First Day Above 50 SMA After Extended Time Below 200 SMA
The first day above the 50-day simple moving average after an extended stretch below the 200-day SMA is a notable bullish reversal signal because it suggests a stock may be transitioning from deep weakness into early recovery. Traders watch this pattern closely because it can mark one of the first meaningful momentum improvements after a long bearish period. It also makes sense to compare this setup with Crossed Above 50 SMA to see whether the move is simply a normal reclaim or a stronger recovery from a much more damaged trend.
day1gt50sma_200sma
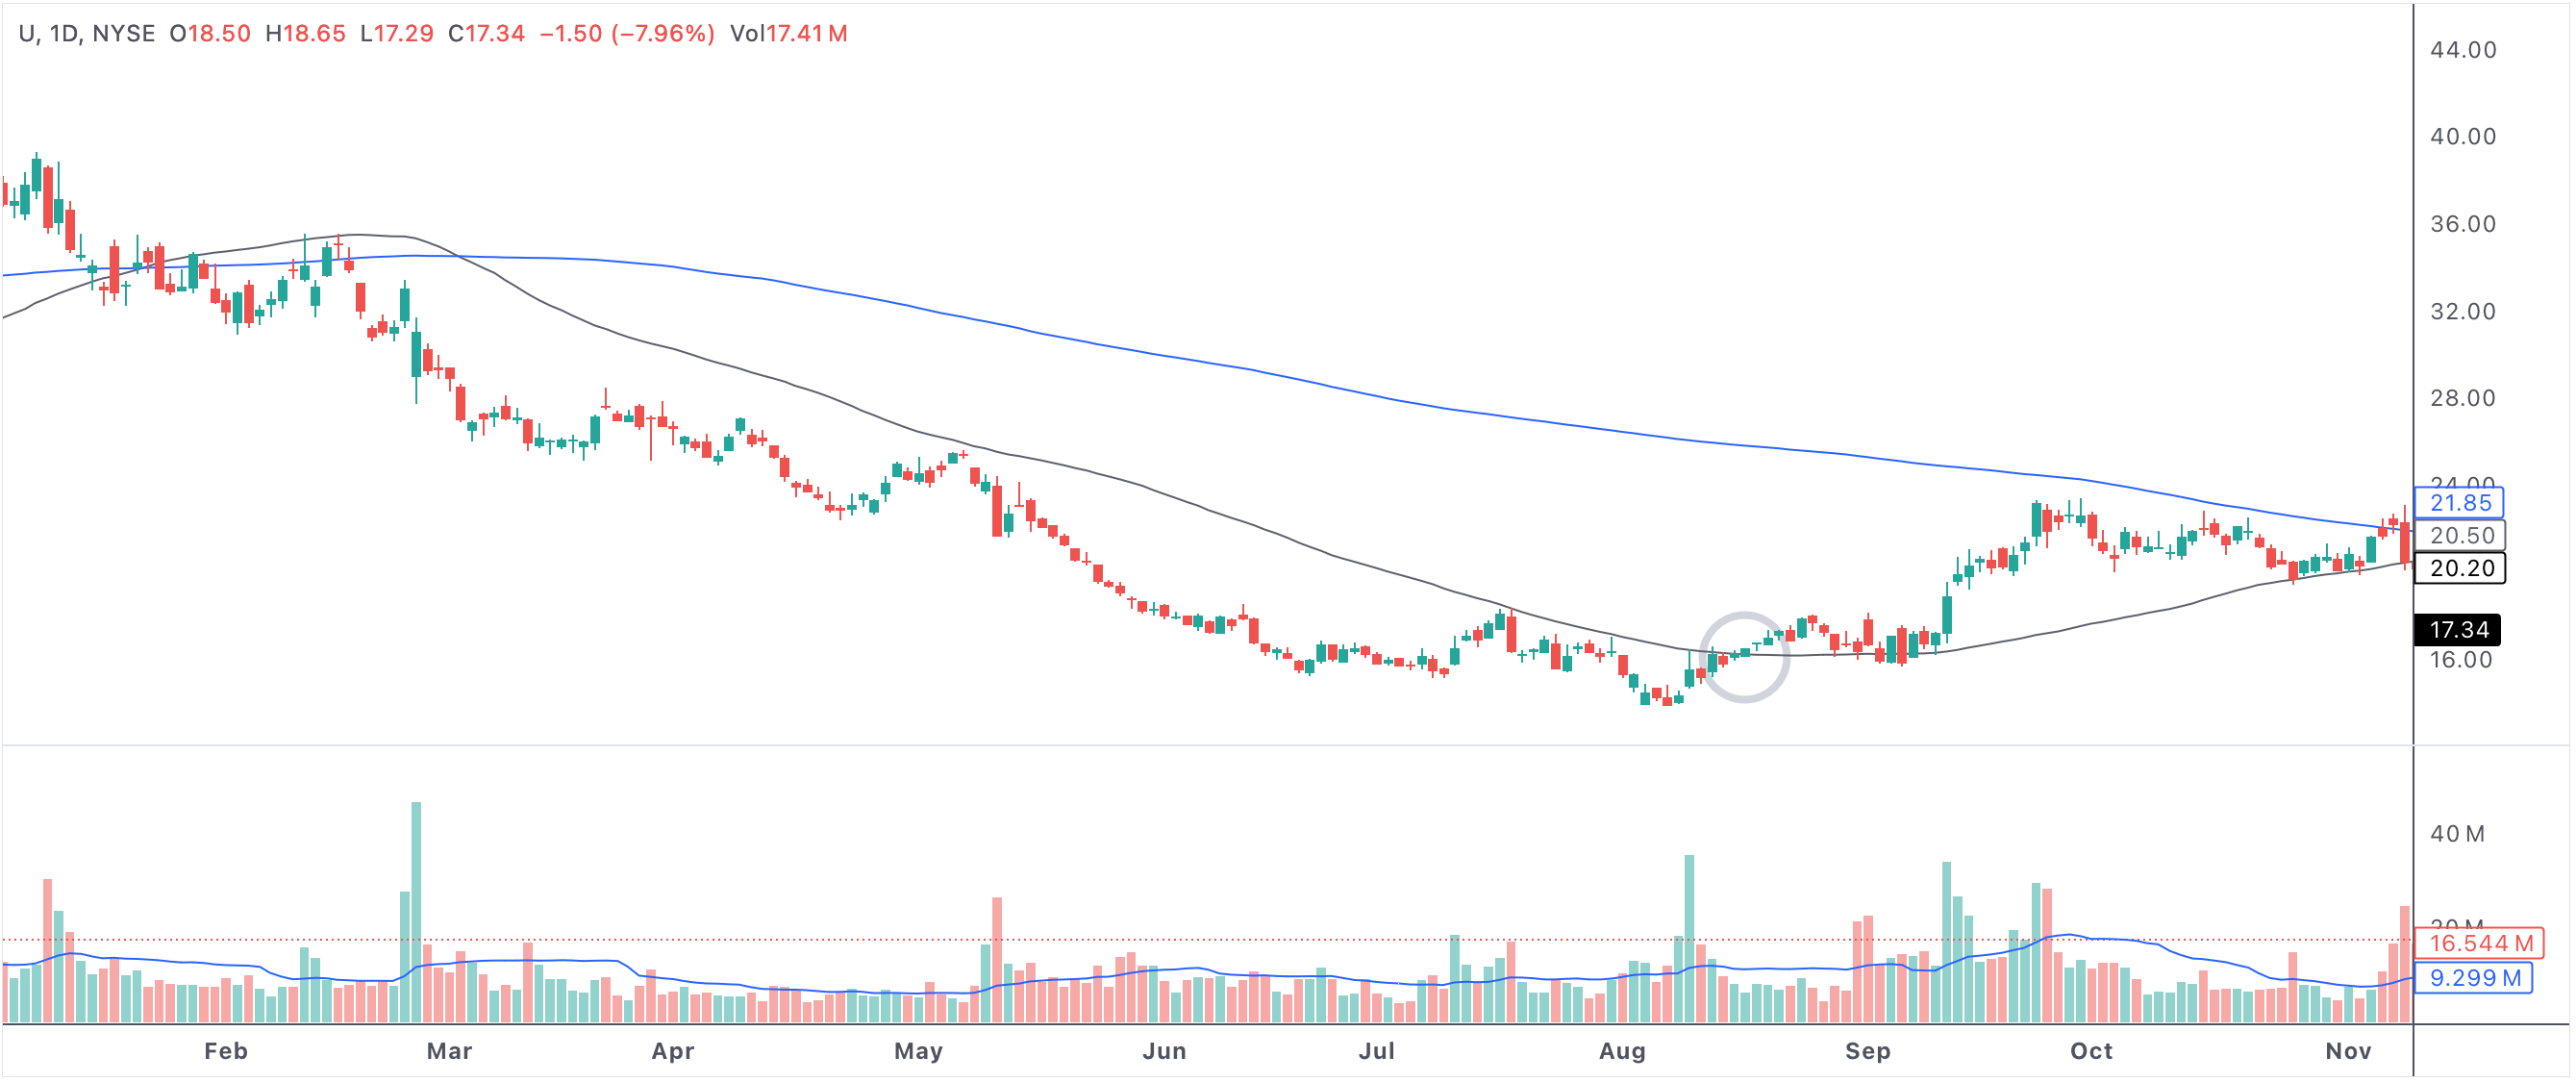
Example of a stock breaking above the 50-day SMA after a long period below the 200-day SMA.
First day above 50 SMA after longest consecutive days below 200 SMA
Why This Moving-Average Combination Matters
The 50-day SMA is commonly used to judge intermediate trend health, while the 200-day SMA is one of the market's most widely watched long-term trend markers. When a stock spends a long time below the 200-day SMA, sentiment is usually poor and the trend is considered damaged. A breakout back above the 50-day SMA can therefore be meaningful because it shows buyers are regaining control before the longer-term trend has fully repaired.
Why Traders See This As Bullish
This pattern is often bullish because it signals a clear momentum shift. The stock is no longer simply oversold; it is beginning to reclaim an important average after a prolonged period of weakness. That can attract early reversal traders, short-covering, and eventually larger trend-following money if price continues to improve.
- Momentum shift: reclaiming the 50-day SMA suggests buyers are becoming more aggressive.
- Trend repair: the move can be an early sign that a long bearish phase is ending.
- Better risk definition: traders often use the 50-day SMA or recent lows to manage downside.
- Improving sentiment: a stock that was badly damaged may start to attract attention once it proves it can reclaim a key average.
How Traders Use The Setup
Some traders enter on the initial close above the 50-day SMA, while others wait for confirmation such as stronger volume, a second close above the average, or supporting signals from RSI and MACD. The best versions of this pattern usually appear when price is also building higher lows or emerging from a long base rather than simply bouncing randomly inside a weak trend.
Like any reversal signal, this one can fail. If the stock quickly loses the 50-day SMA again, it may just be a temporary oversold bounce. That is why confirmation and risk management remain important. But when the move holds, this setup can help traders identify trend repair earlier than the crowd.
Why This Scan Has Search Value
For traders looking for stocks emerging from prolonged weakness, this scan is especially useful because it narrows the field to names that are starting to repair broken charts. It highlights a specific type of early recovery pattern that can be attractive to both swing traders and longer-term investors looking for improving technical conditions.