First Day Below 10 SMA After an Extended Run Above
The first day below the 10-day simple moving average (SMA) after a long streak above it can be an early sign that short-term momentum is fading. When a stock stays above the 10-day SMA for many sessions, it usually means buyers have remained in control. A close back below that line can mark the first crack in that momentum. Traders often compare this setup with stocks above the 10-day SMA for the most consecutive days, since the breakdown signal is more meaningful after a prolonged stretch of strength.
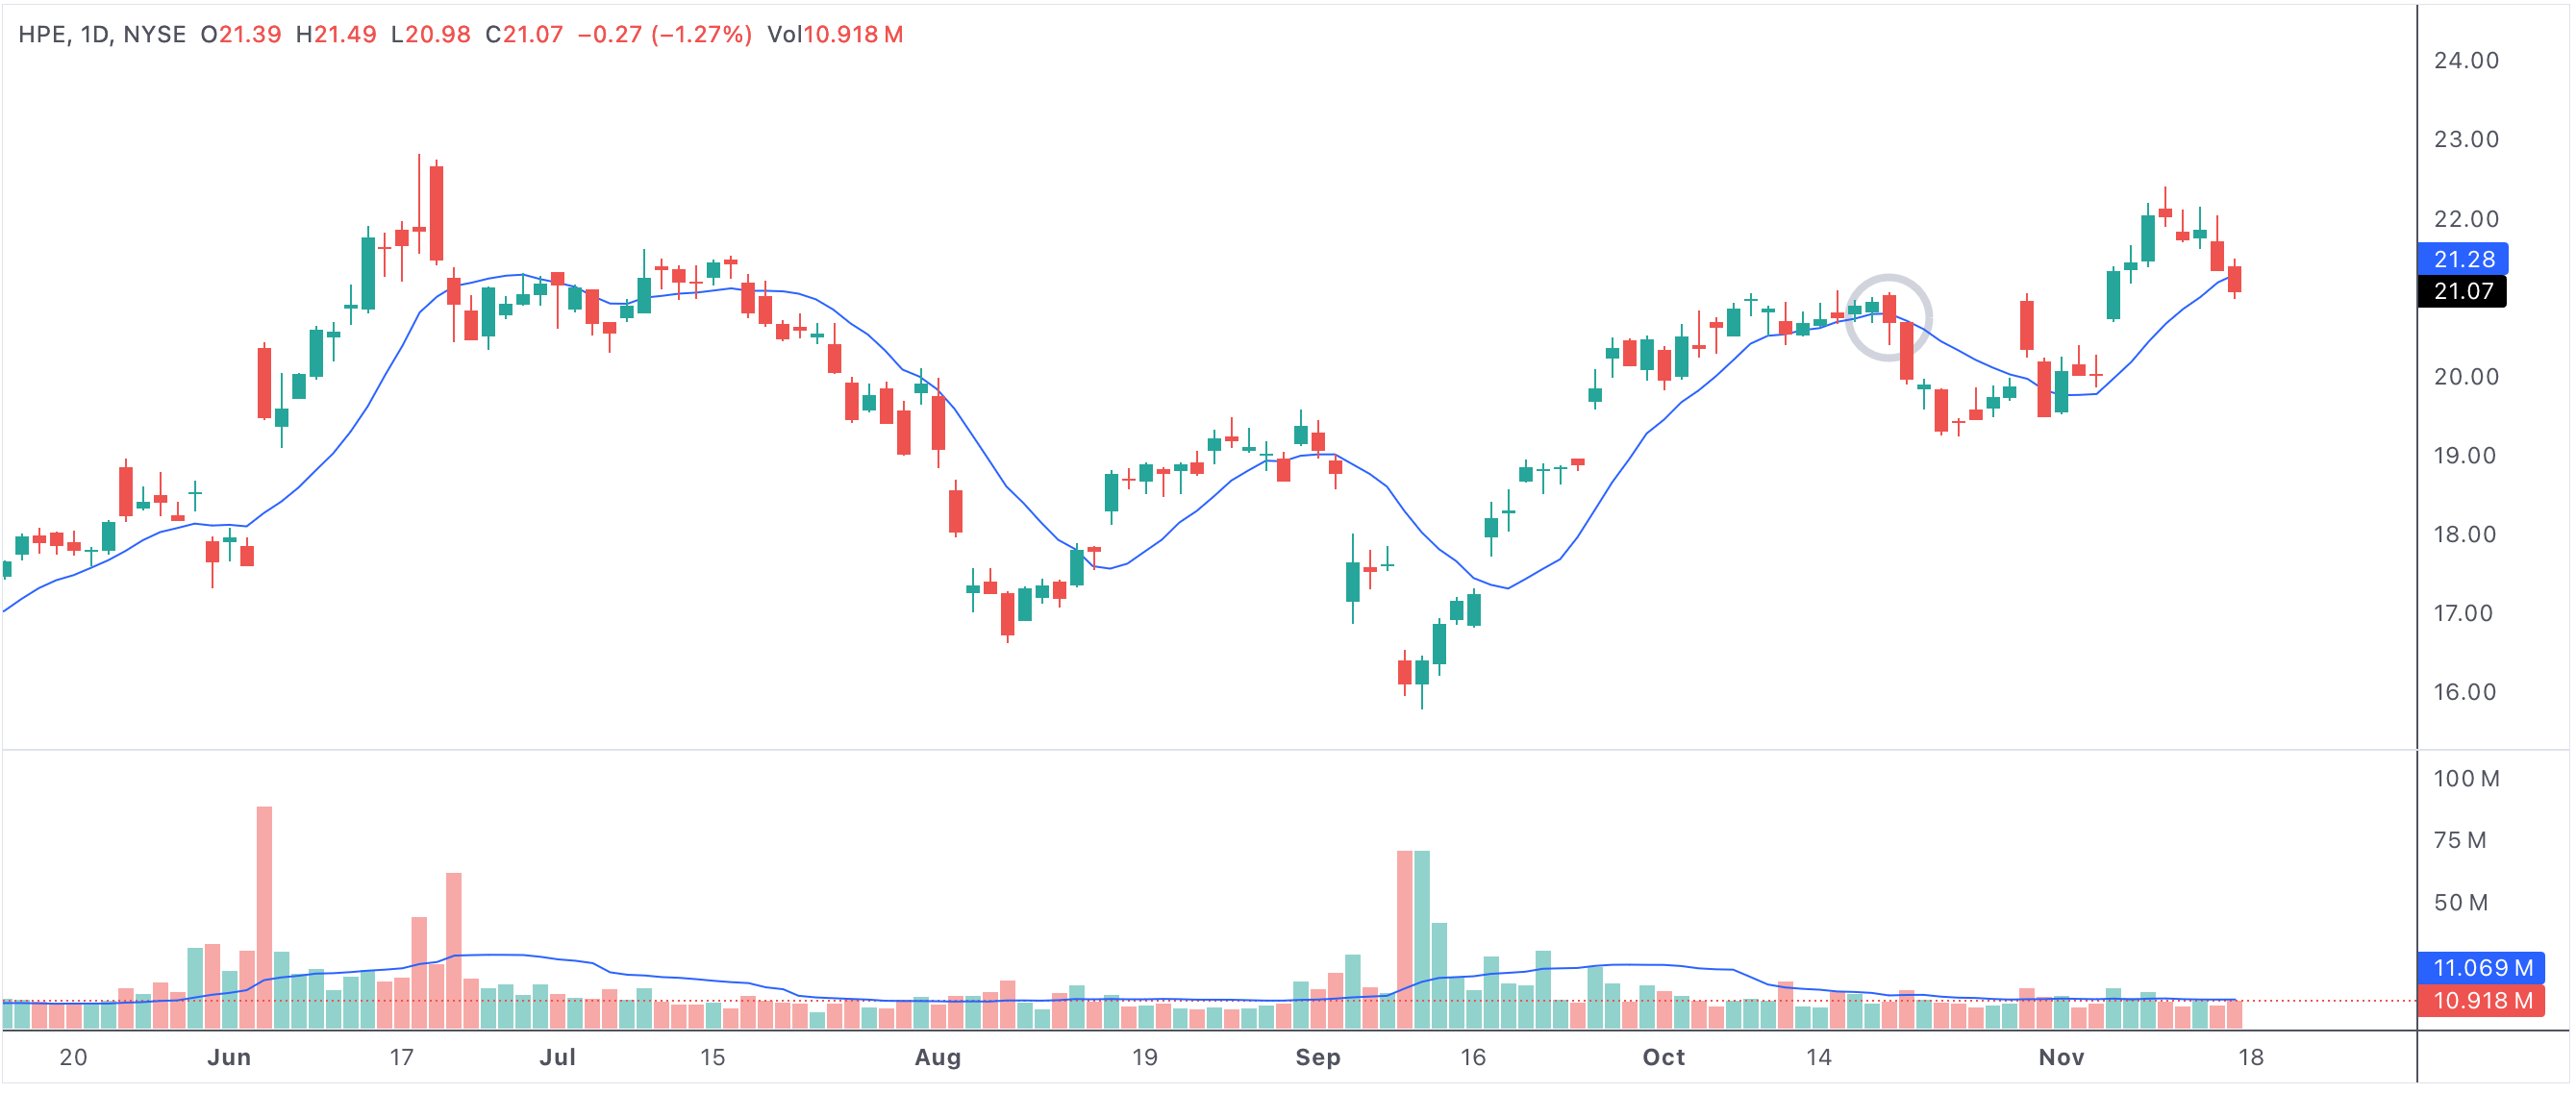
day1lt10sma
An example of a stock slipping below its 10-day SMA after an extended run above it.
First day below 10 SMA after longest consecutive days above
Why This Matters
The 10-day SMA is a fast-moving measure of short-term trend health. After a long run above it, a close below the average can show that upside momentum is slowing and that buyers may no longer be controlling every dip the way they were before.
That does not automatically mean a larger reversal is underway, but it often signals that the trend deserves a closer look.
How Traders Use It
Some traders use this setup to tighten stops or avoid chasing a stock after a strong run. Others look for additional confirmation such as heavier selling volume, a lower high, or a break of nearby support. The main value is spotting the first real sign of short-term deterioration.
- A close below the 10-day SMA can mark the first weakness after a strong streak.
- The setup matters more when it follows a prolonged period of strength.
- Follow-through and price structure help confirm the signal.
- This screen is useful for spotting early momentum cracks.