First UT Bot Sell Signal After an Extended Buy Streak
The first UT Bot sell signal after a long streak of buy signals can mark an important momentum transition. It tells traders that a trend which had been persistently strong is finally showing enough weakness to trigger the model in the opposite direction. That does not always mean a major top is in place, but it often means the easy part of the advance may be over. A related setup worth comparing is the first UT Bot sell signal after the biggest percent gain, since both scans focus on when strong upside action begins to fade.
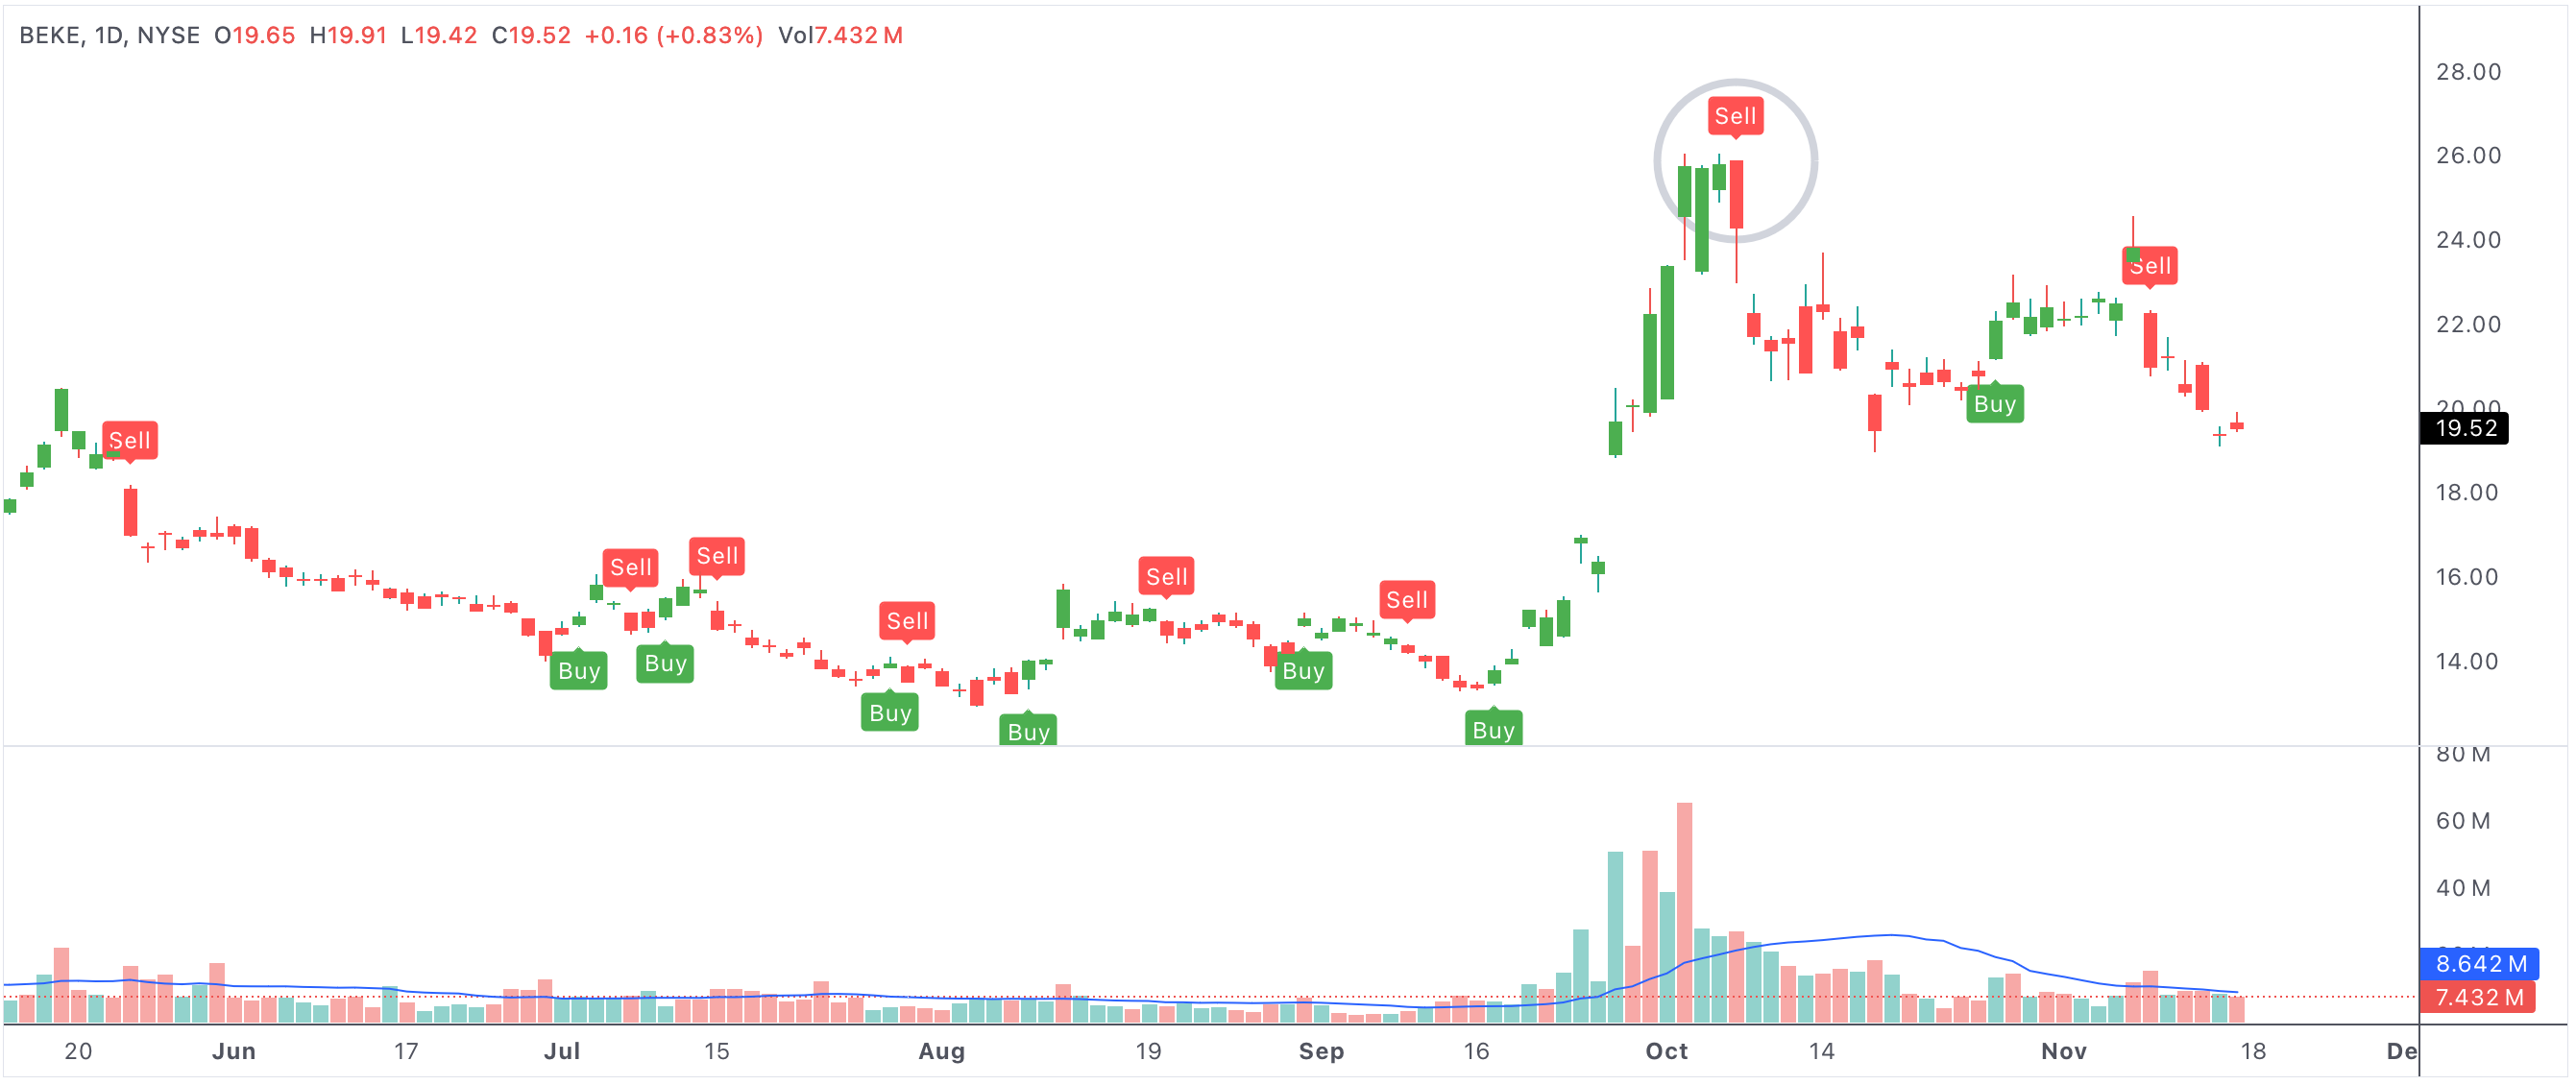
firstutbotdownday
An example of a first UT Bot sell signal appearing after an extended sequence of buy signals.
First UT bot sell day after longest consecutive buy days
Why This Signal Stands Out
A long run of UT Bot buy signals usually reflects a persistent uptrend, strong trend-following behavior, or repeated price support above the model's stop logic. When that streak ends, traders pay attention because the trend has finally changed enough to register as a sell event. The longer the prior streak, the more noteworthy the break can be.
In practice, this signal often appears when momentum is slowing, volatility is increasing, or buyers are no longer defending pullbacks as cleanly as before.
How Traders Interpret It
Some traders use the first sell signal as a reason to reduce exposure or lock in gains. Others simply treat it as a warning and wait to see whether price breaks further support. The most important question is whether the uptrend is merely pausing or beginning a larger reversal.
- A first sell signal after a long buy streak can flag a meaningful change in trend behavior.
- The setup tends to matter more when the prior uptrend was persistent and extended.
- Confirmation from price structure helps separate routine pullbacks from real breakdowns.
- This signal is often most useful for risk management and trade review.
How To Use The Screen
This scan can help traders find stocks that were leaders but may now be rolling over. That makes it useful for profit protection, avoiding late entries, and spotting names that deserve closer follow-up after a long run of strength.