Green Day Followed by a Bearish 2-Down Breakout That Closes Red
A green day followed by a bearish 2-down breakout that also closes red is a clean downside continuation pattern. Under The Strat framework, the 2-down bar breaks below the prior candle's range, and the red close confirms sellers stayed in control through the session. Traders often compare this setup with a green day followed by a bullish 2-up breakout that closes red, since one shows clean bearish continuation while the other reflects a more conflicted bullish attempt.
greenredbear
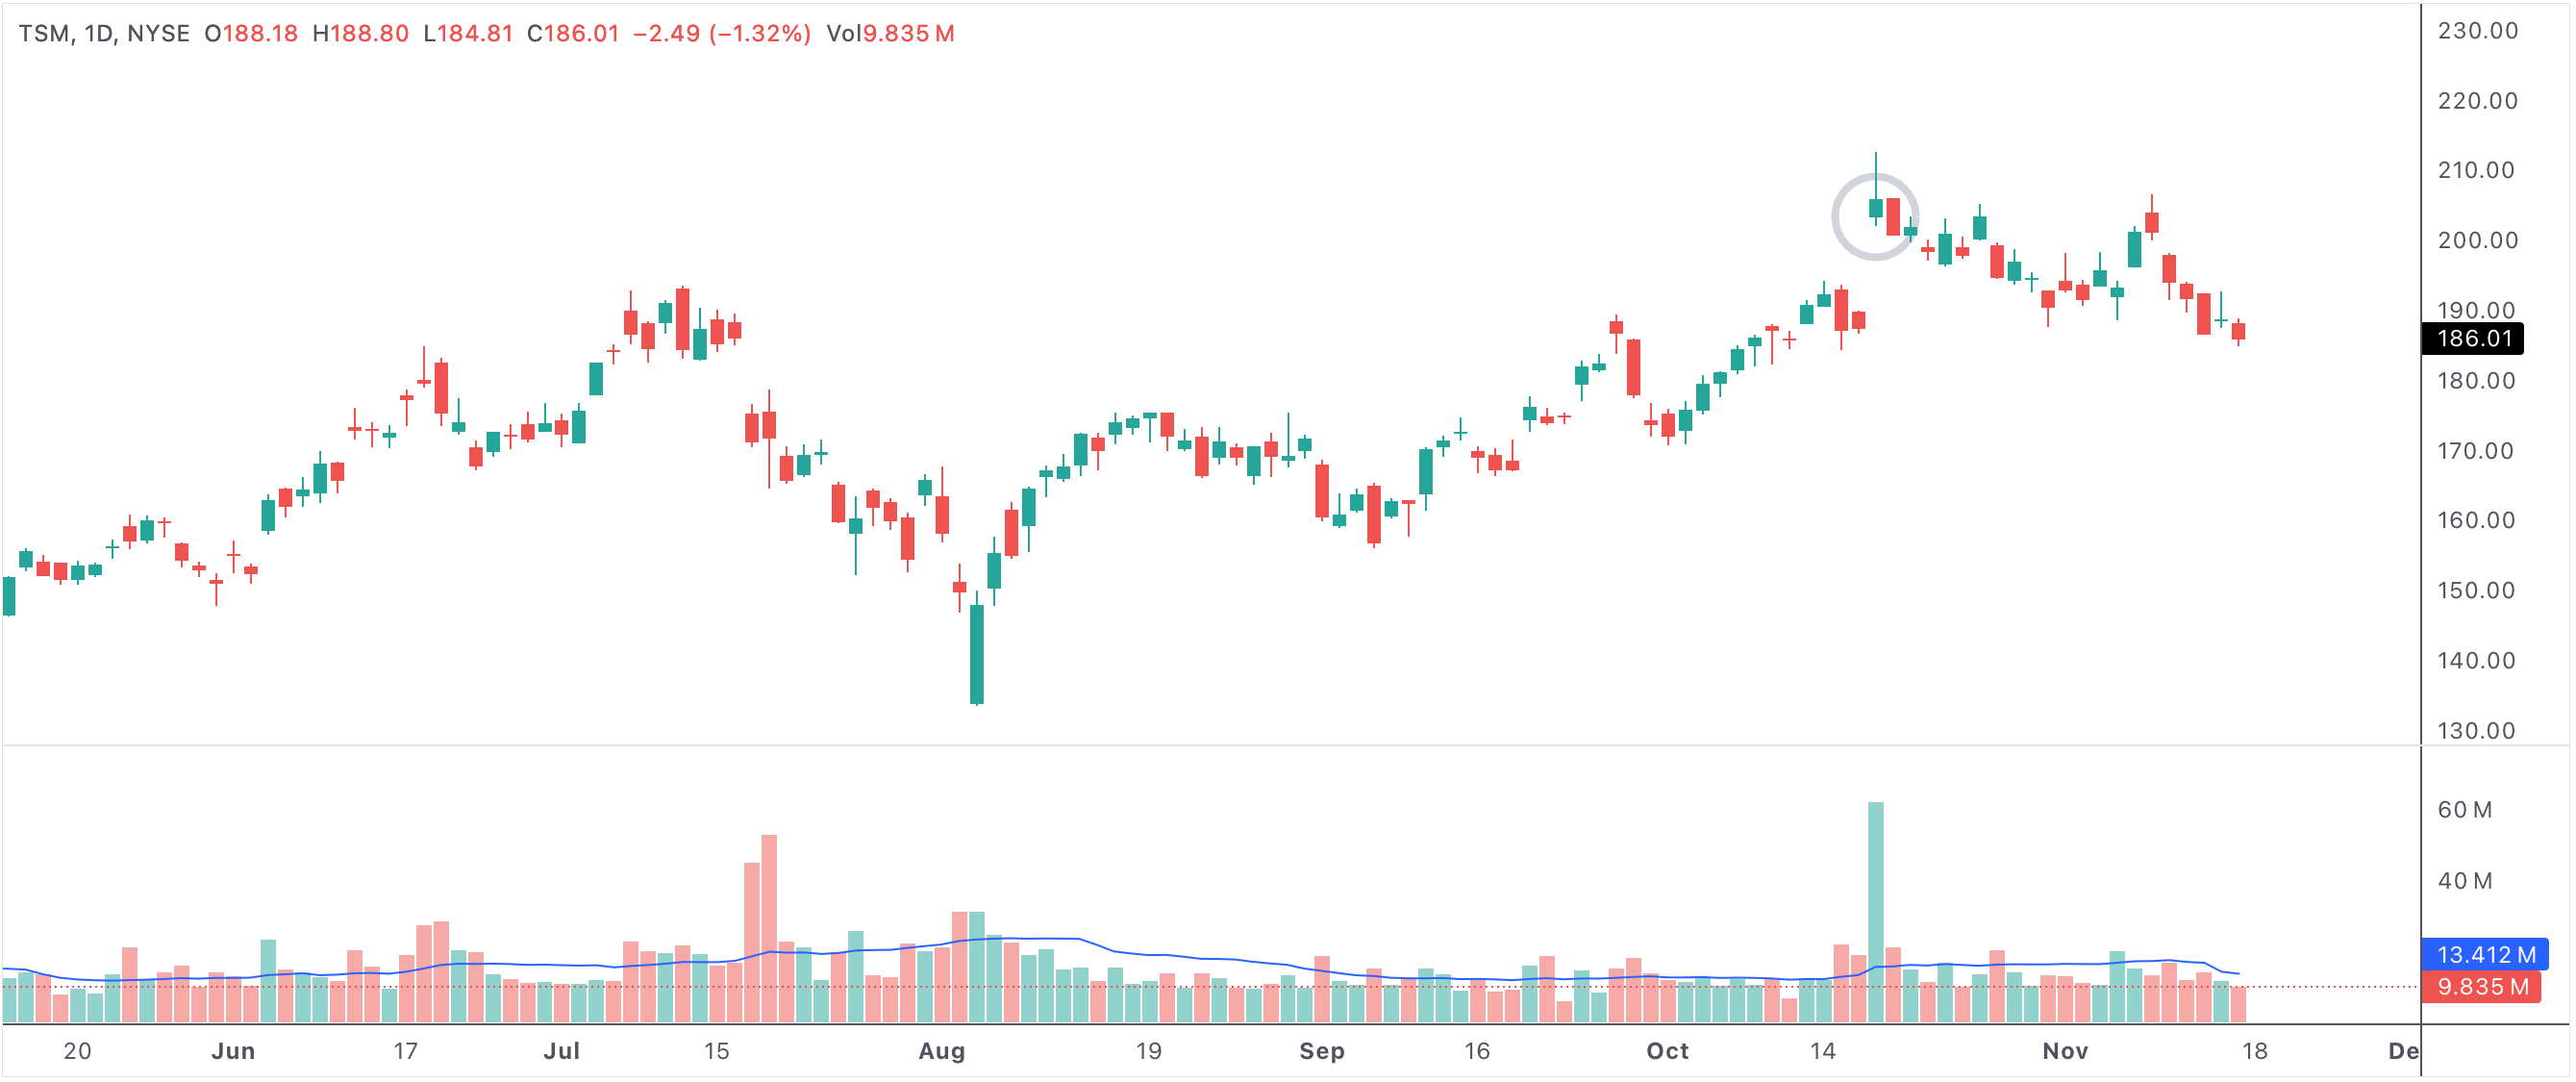
An example of a bearish 2-down breakout that follows through with a red close.
A green day is followed by a 2-down breakout with a red bar.
Why This Pattern Matters
This setup is useful because both the breakout direction and the close tell the same story. Sellers broke price lower and kept control into the close, which often reflects decisive bearish pressure. Compared with mixed candles, this pattern usually carries a clearer message.
It becomes more important when it appears near resistance, after a failed rally, or during broader market weakness.
How Traders Use It
Some traders use this pattern to spot breakdown candidates or continued downside momentum. Others use it as a warning that a recent bounce may already be failing. The main value is identifying charts where bearish intent is showing up clearly in the candle structure.
- The 2-down breakout signals downside expansion.
- A red close confirms sellers controlled the session.
- The setup is cleaner and more decisive than mixed conflict candles.
- This pattern is useful for spotting bearish continuation and failed bounces.