Longest Consecutive Down Days - Selling Pressure and Reversal Risk
The longest consecutive down days in a stock or index can reveal where selling pressure has become unusually persistent. A multi-day losing streak is often a sign of bearish momentum, weak sentiment, and urgent risk reduction by market participants. Traders also compare this kind of washout behavior with Very High Bollinger Band Width because sharp losing streaks often show up in the same kind of unstable, high-volatility environments.
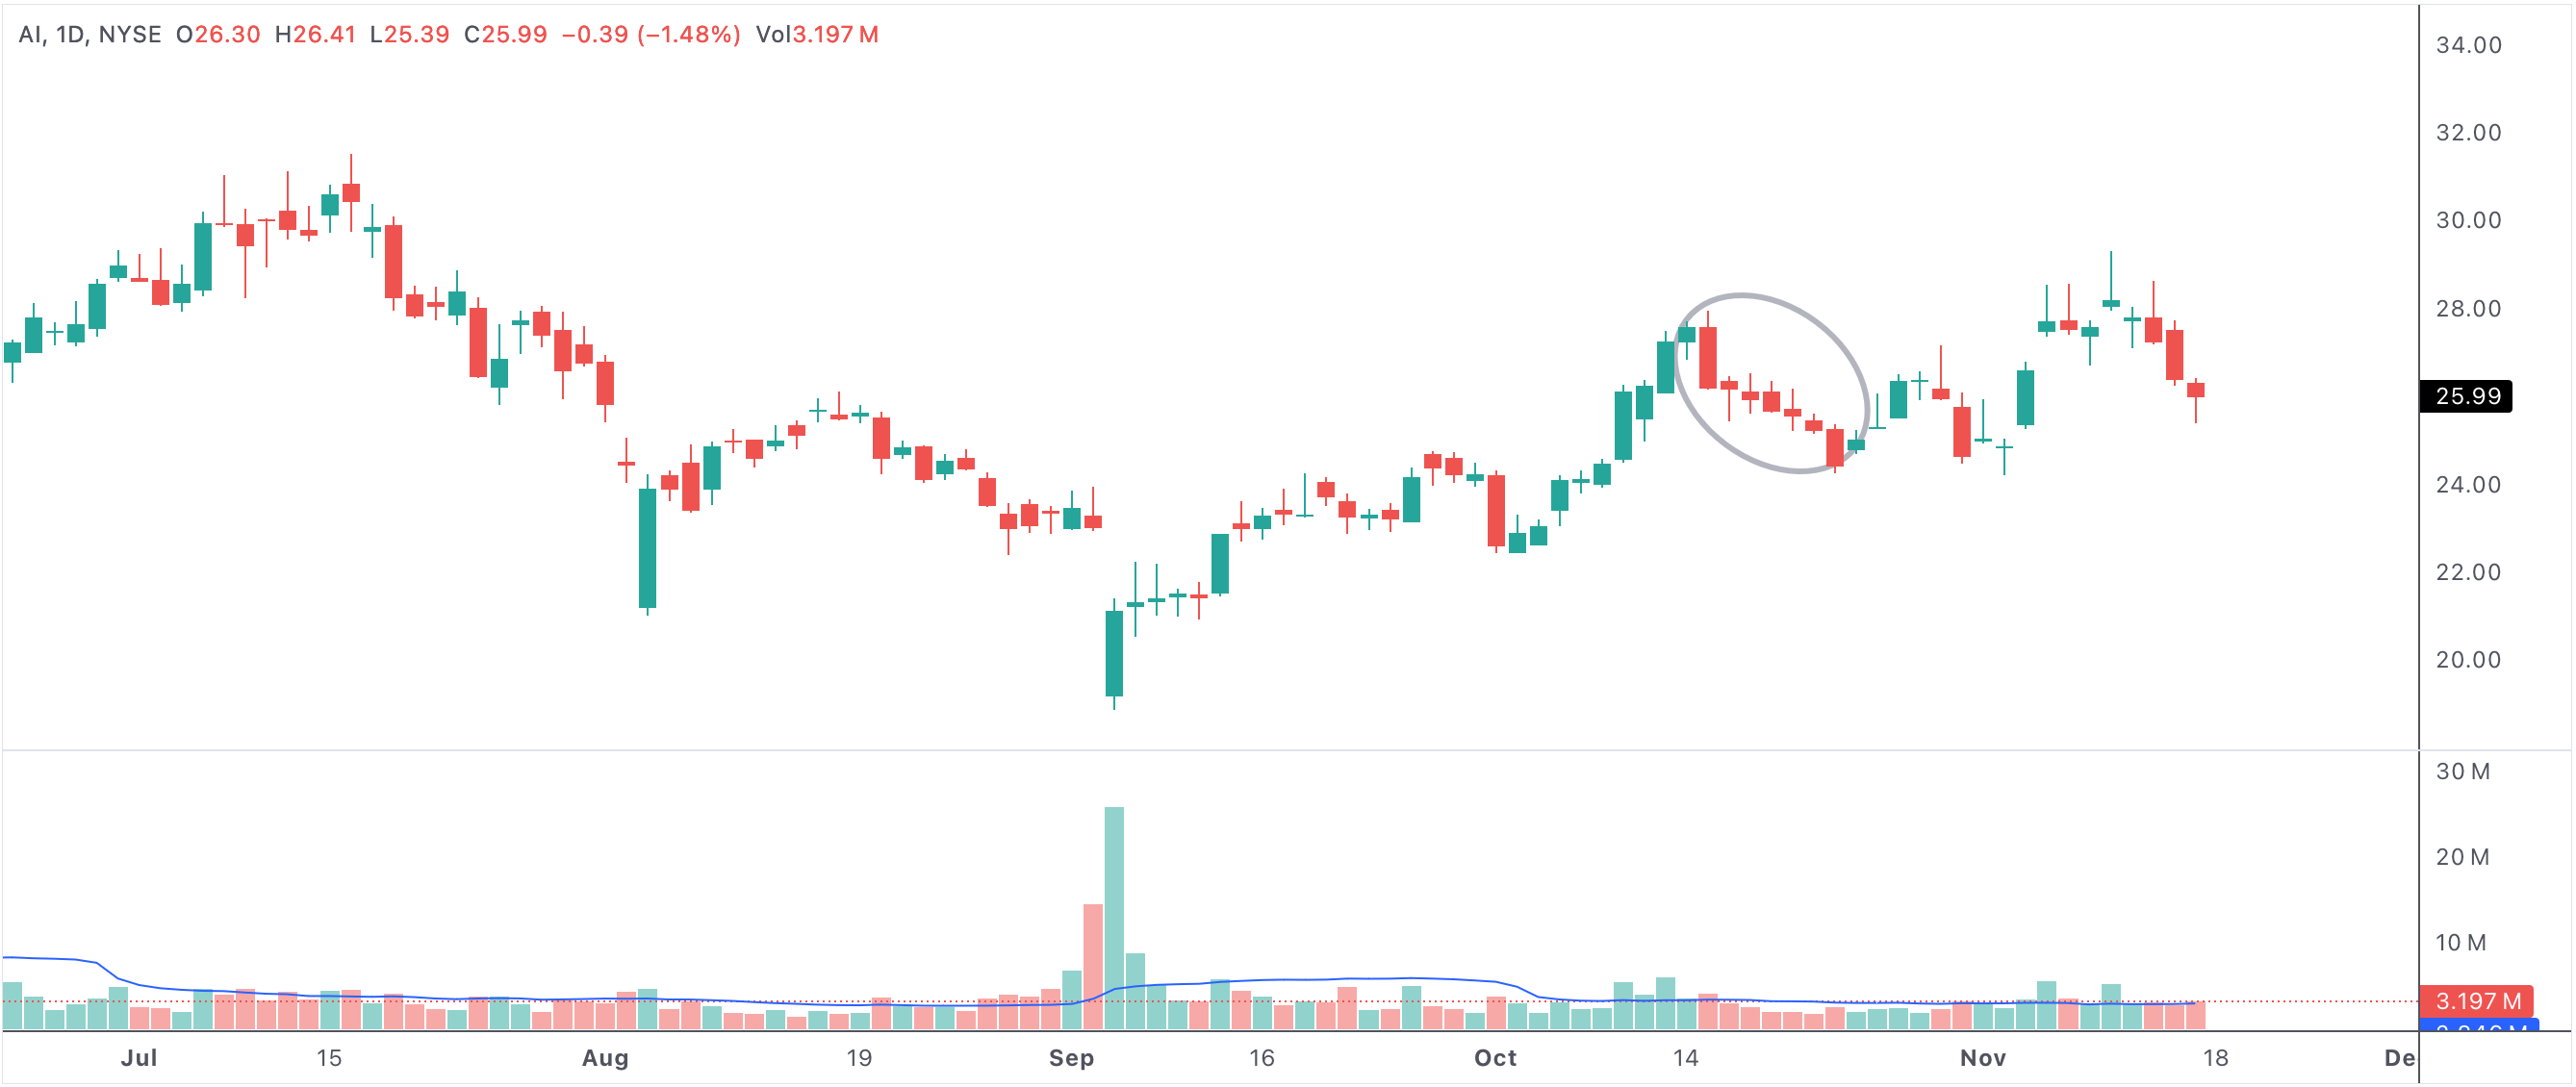
downdays
An example of a stock with extended consecutive down days.
Stocks with extended consecutive down days
Why A Long Losing Streak Matters
Consecutive down days matter because they show that sellers have been able to push price lower again and again without meaningful interruption. That usually means demand is weak, sentiment is deteriorating, or the market is repricing risk aggressively. Long streaks often attract attention from short sellers, risk managers, and contrarian traders looking for signs of exhaustion.
What This Pattern Can Signal
Sometimes the streak is simply confirmation of a strong downtrend. In other cases, the very length of the streak can push the stock into oversold territory and set up a sharp countertrend bounce. The key is context: whether volume is expanding, whether the decline is orderly or panicked, and whether any support level is nearby.
- Consecutive down days often confirm persistent selling pressure.
- Longer streaks can indicate fear, forced selling, or a damaged trend.
- Extreme streaks may also create oversold rebound potential.
- Volume and price structure help determine whether the move is still active or becoming exhausted.
- The pattern is useful for both bearish continuation and reversal watchlists.
How Traders Use It
Trend-following traders may use long down streaks to identify weak names that should be avoided or sold short. Contrarian traders may monitor the same list for capitulation setups, especially if a high-volume reversal or momentum divergence appears. That dual use makes the scan valuable: it helps identify where the market is under stress and where a turning point may eventually develop.