Most Consecutive Days With RSI Above 70
The most consecutive days with RSI above 70 can highlight stocks with exceptional momentum, but also stocks at risk of becoming overextended. RSI above 70 is commonly treated as overbought, yet strong trends can stay overbought for long stretches. That is why a long streak above 70 can signal both leadership and rising reversal risk. Traders often compare this setup with the most consecutive days with RSI under 30, since the two screens highlight opposite momentum extremes.
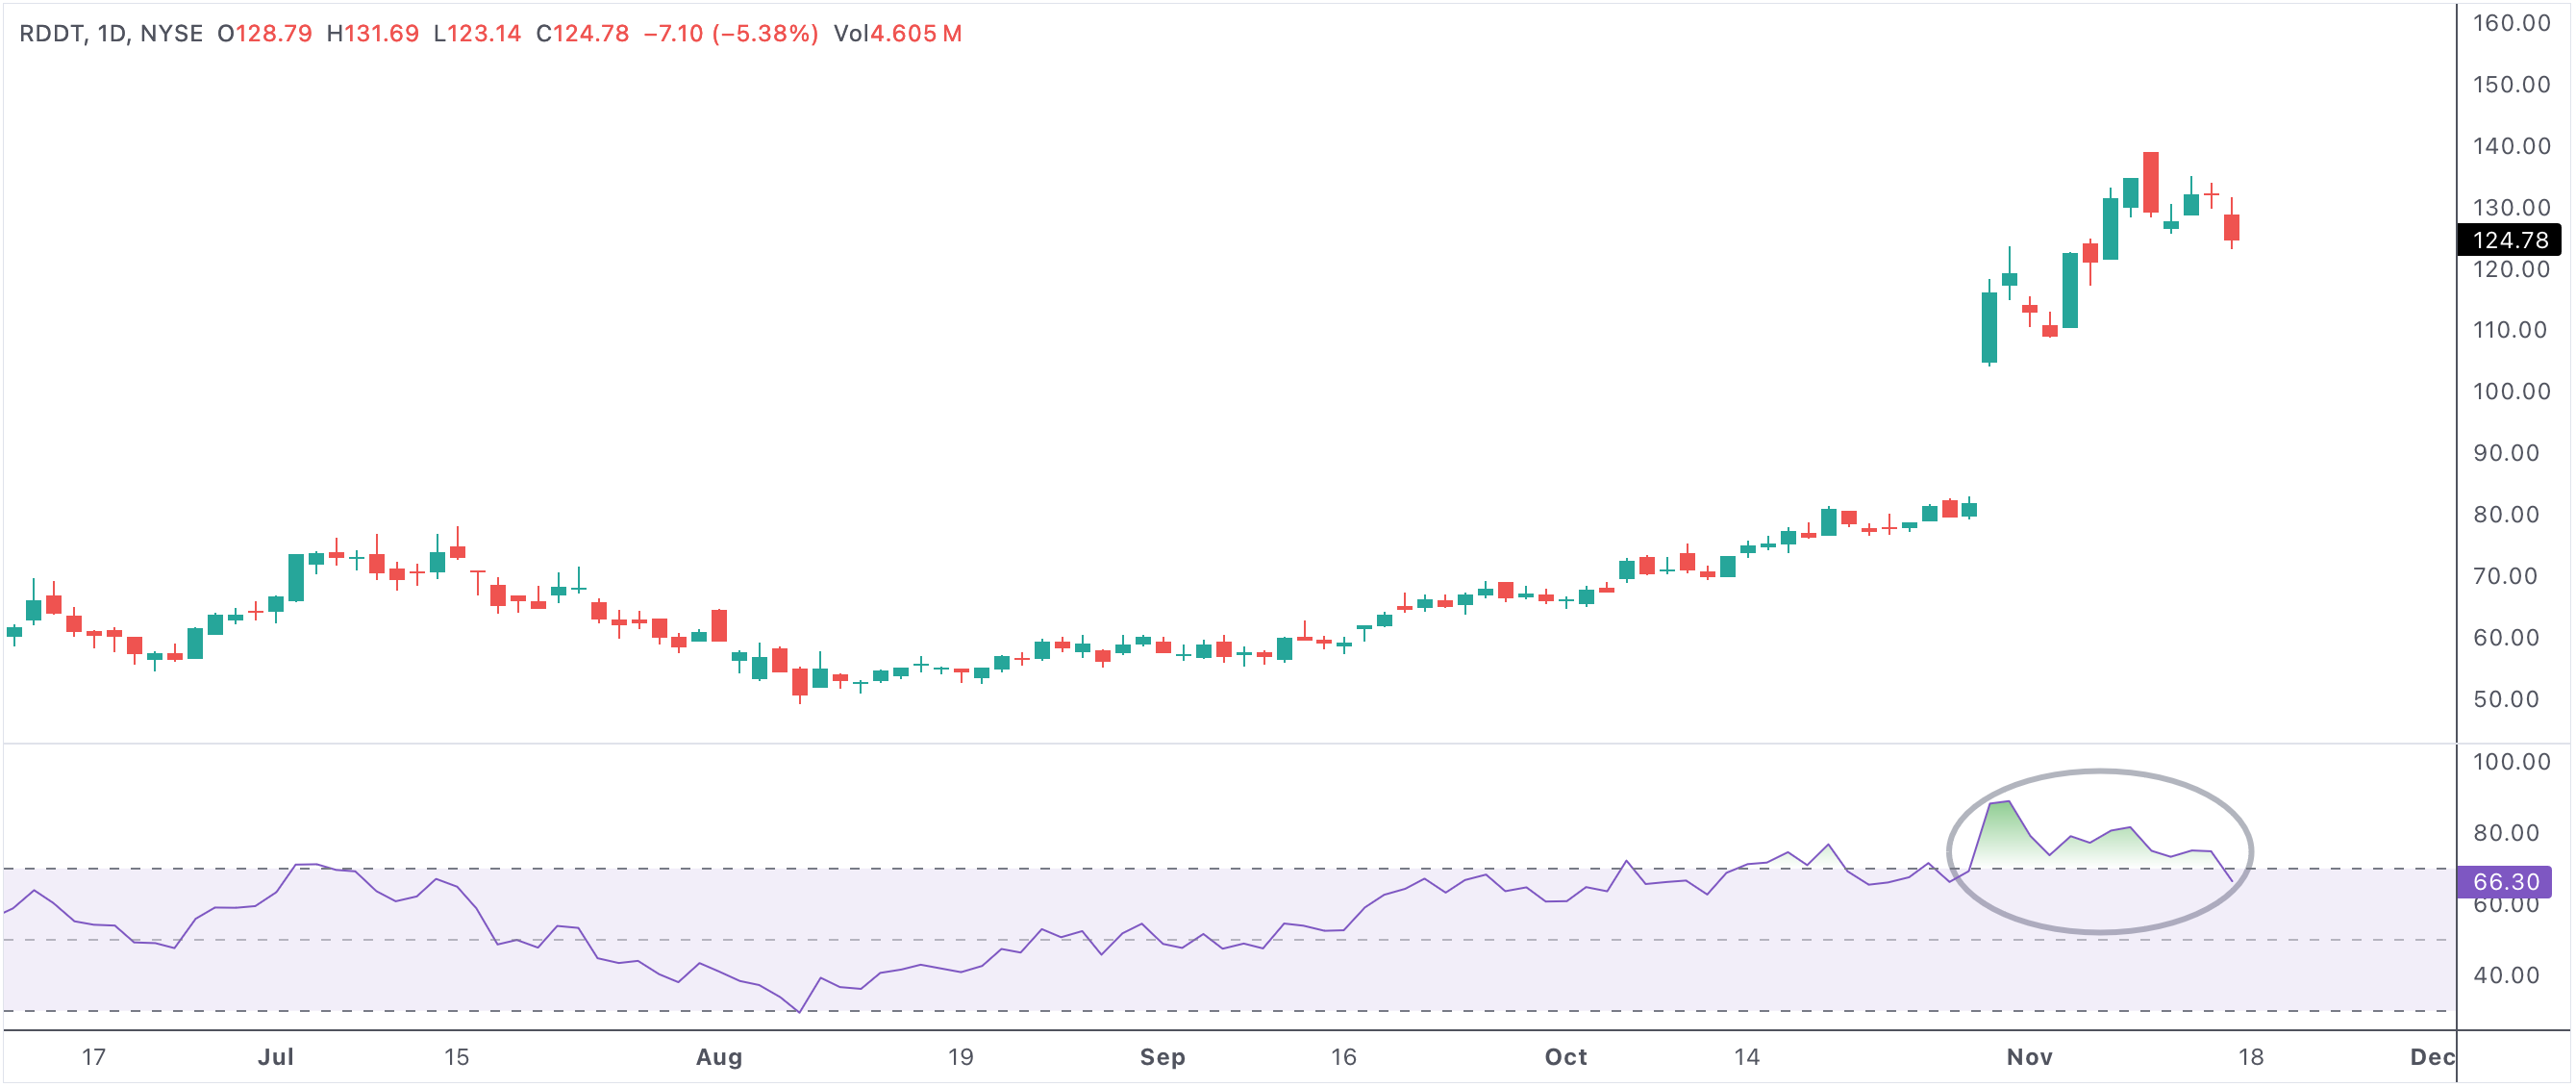
rsioverbought
An example of a stock staying overbought by RSI for an extended streak.
Most consecutive days with RSI above 70
Why A Long Overbought Streak Matters
Most stocks do not stay above RSI 70 for very long. When they do, it usually means demand is unusually strong and momentum traders are in control. That can be bullish, but it also means expectations are elevated and the chart may be vulnerable if momentum starts to cool.
The longer the streak lasts, the more important it becomes to judge whether the trend is still healthy or simply getting overheated.
How Traders Use It
Some traders use this screen to find strong leaders worth following in trend-friendly markets. Others use it to spot names they do not want to chase after an already extended run. The context of price structure, volume, and broader market conditions matters more than the RSI streak alone.
- Long RSI-over-70 streaks can signal both trend strength and overextension.
- Strong trends can remain overbought longer than many traders expect.
- The setup is most useful when paired with price action and support levels.
- This screen helps identify momentum leaders that deserve closer review.