Red Day Followed by a Bearish 2-Down Breakout That Closes Green
A red day followed by a bearish 2-down breakout that still closes green is a conflict pattern. The candle expands below the prior bar, which is bearish under The Strat framework, but buyers recover enough during the session to push the close back above the open. That creates a mixed message: downside continuation was attempted, but buyers pushed back. Traders often compare this setup with a green day followed by the same conflicting 2-down pattern, because both signal tension between breakdown pressure and intraday buying response.
redgreenbear
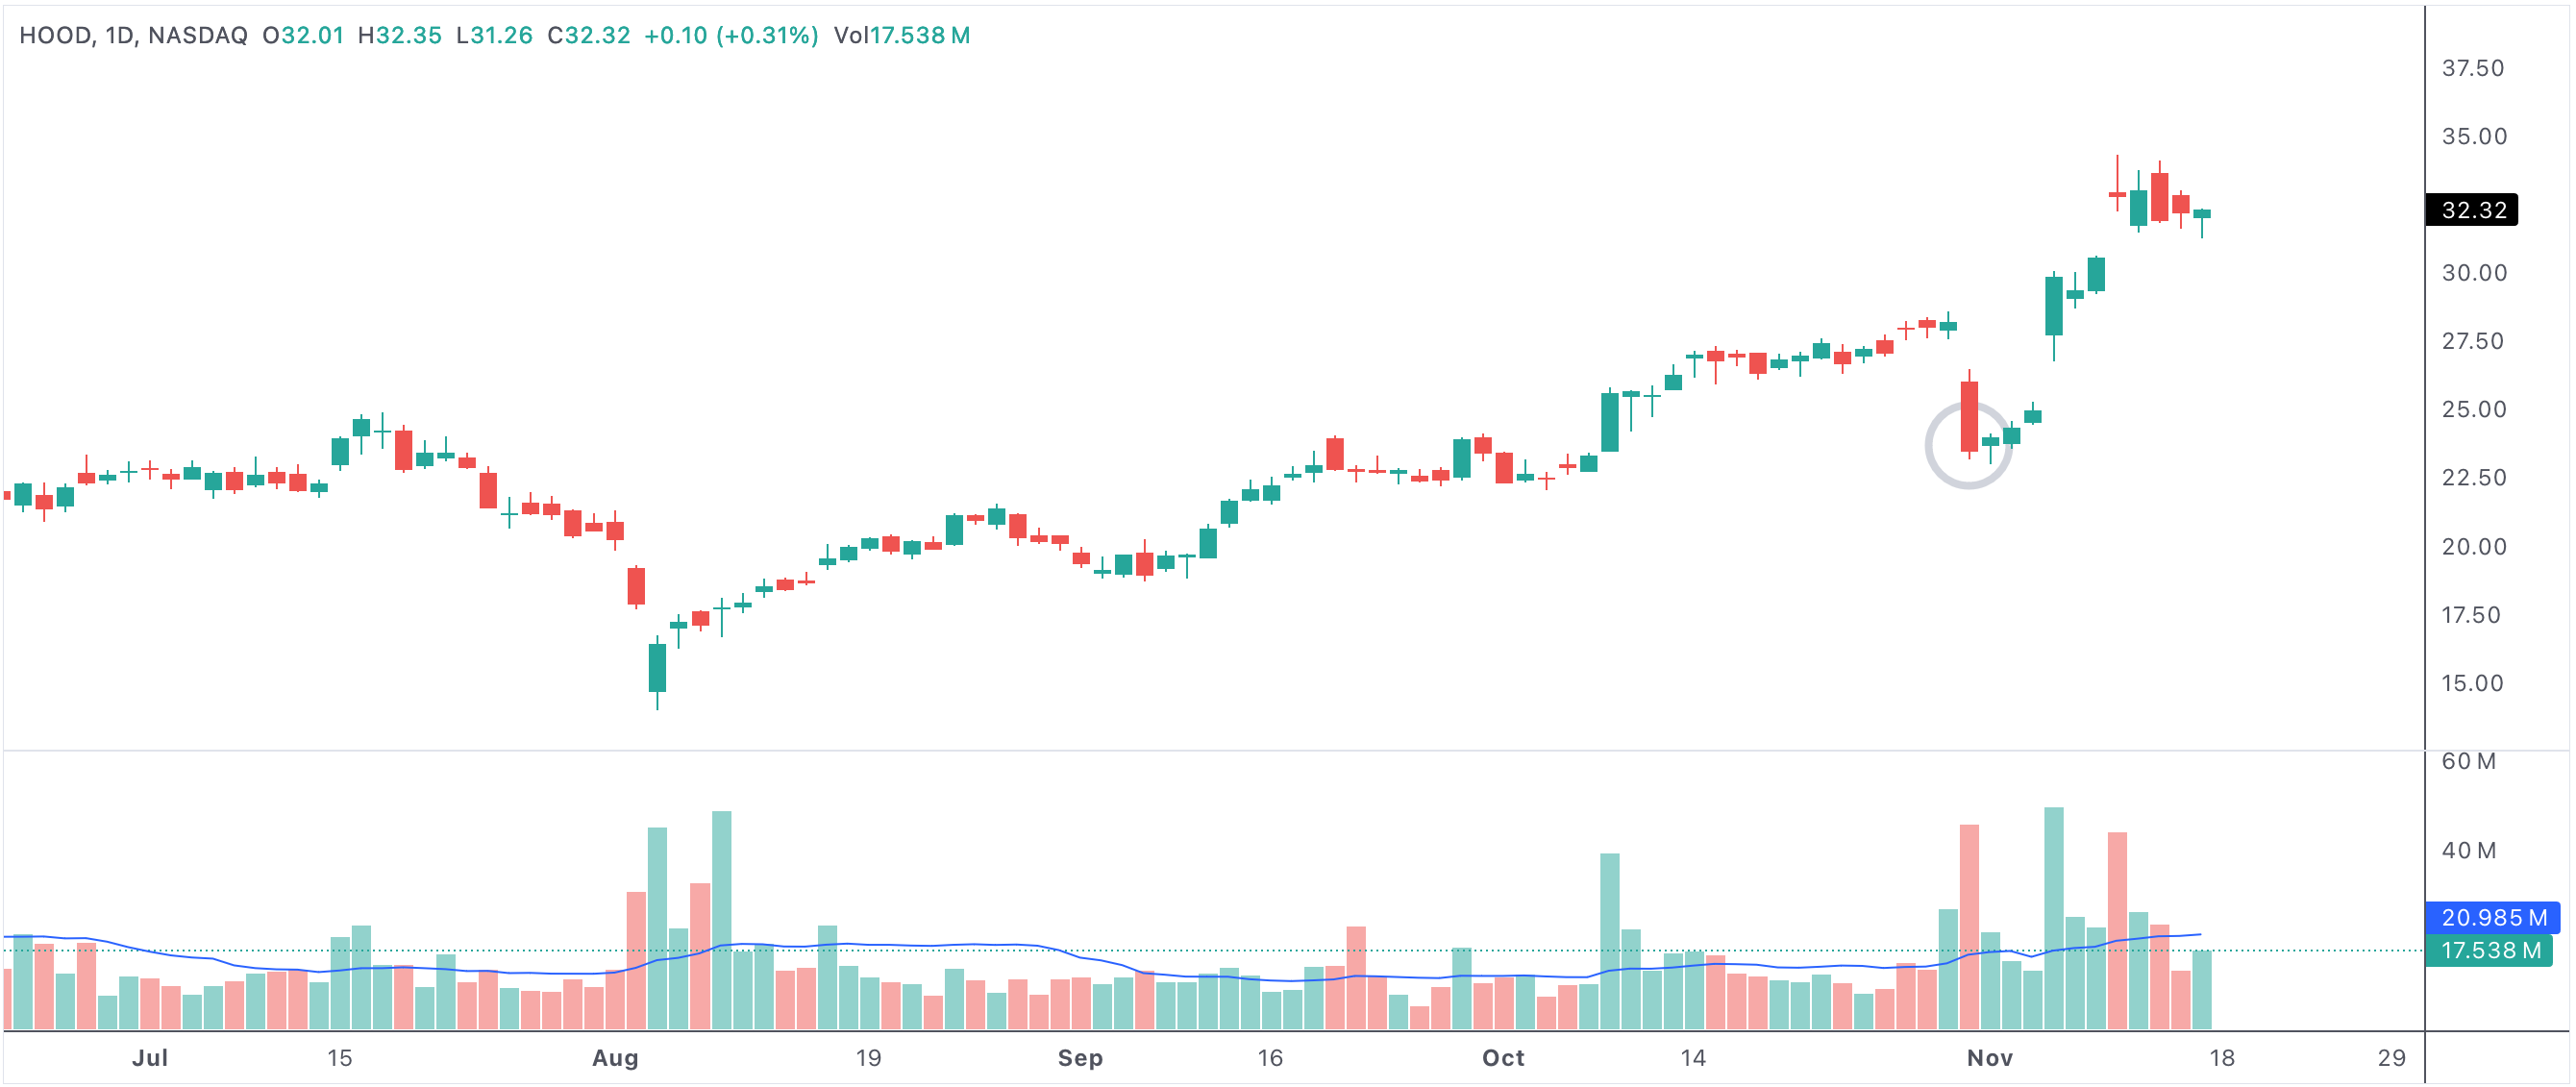
An example of a bearish 2-down breakout that closes green after a red day.
Red day followed by a bearish breakout 2-down with the bar itself green
Why The Pattern Matters
This pattern is useful because it shows that sellers had enough strength to break lower, but not enough to control the close. That tension can mark indecision, short-term exhaustion, or a potential reversal attempt depending on the broader chart context.
It becomes more meaningful near support, after a hard selloff, or when the next candle confirms the buyers' response.
How Traders Read It
Some traders treat it as an early sign that downside pressure is weakening. Others wait for follow-through, since mixed candles can fail quickly in weak markets. The key is whether the next move confirms rejection of lower prices or resumes the breakdown.
- The 2-down breakout is bearish, but the green close shows intraday recovery.
- The pattern often reflects conflict rather than a clean directional signal.
- Support levels and next-day confirmation matter a lot.
- This setup is best used as a context clue, not a standalone trigger.