Red Day Followed by a Bullish 2-Up Breakout That Closes Green
A red day followed by a bullish 2-up breakout that also closes green is a cleaner reversal pattern than its red-closing counterpart. Under The Strat framework, price breaks above the prior candle's range and buyers hold control into the close, which gives the setup a stronger bullish tone. Traders often compare it with a red day followed by a bullish 2-up breakout that closes red, since the two patterns highlight the difference between confirmed upside follow-through and a weaker reversal attempt.
redgreenbull
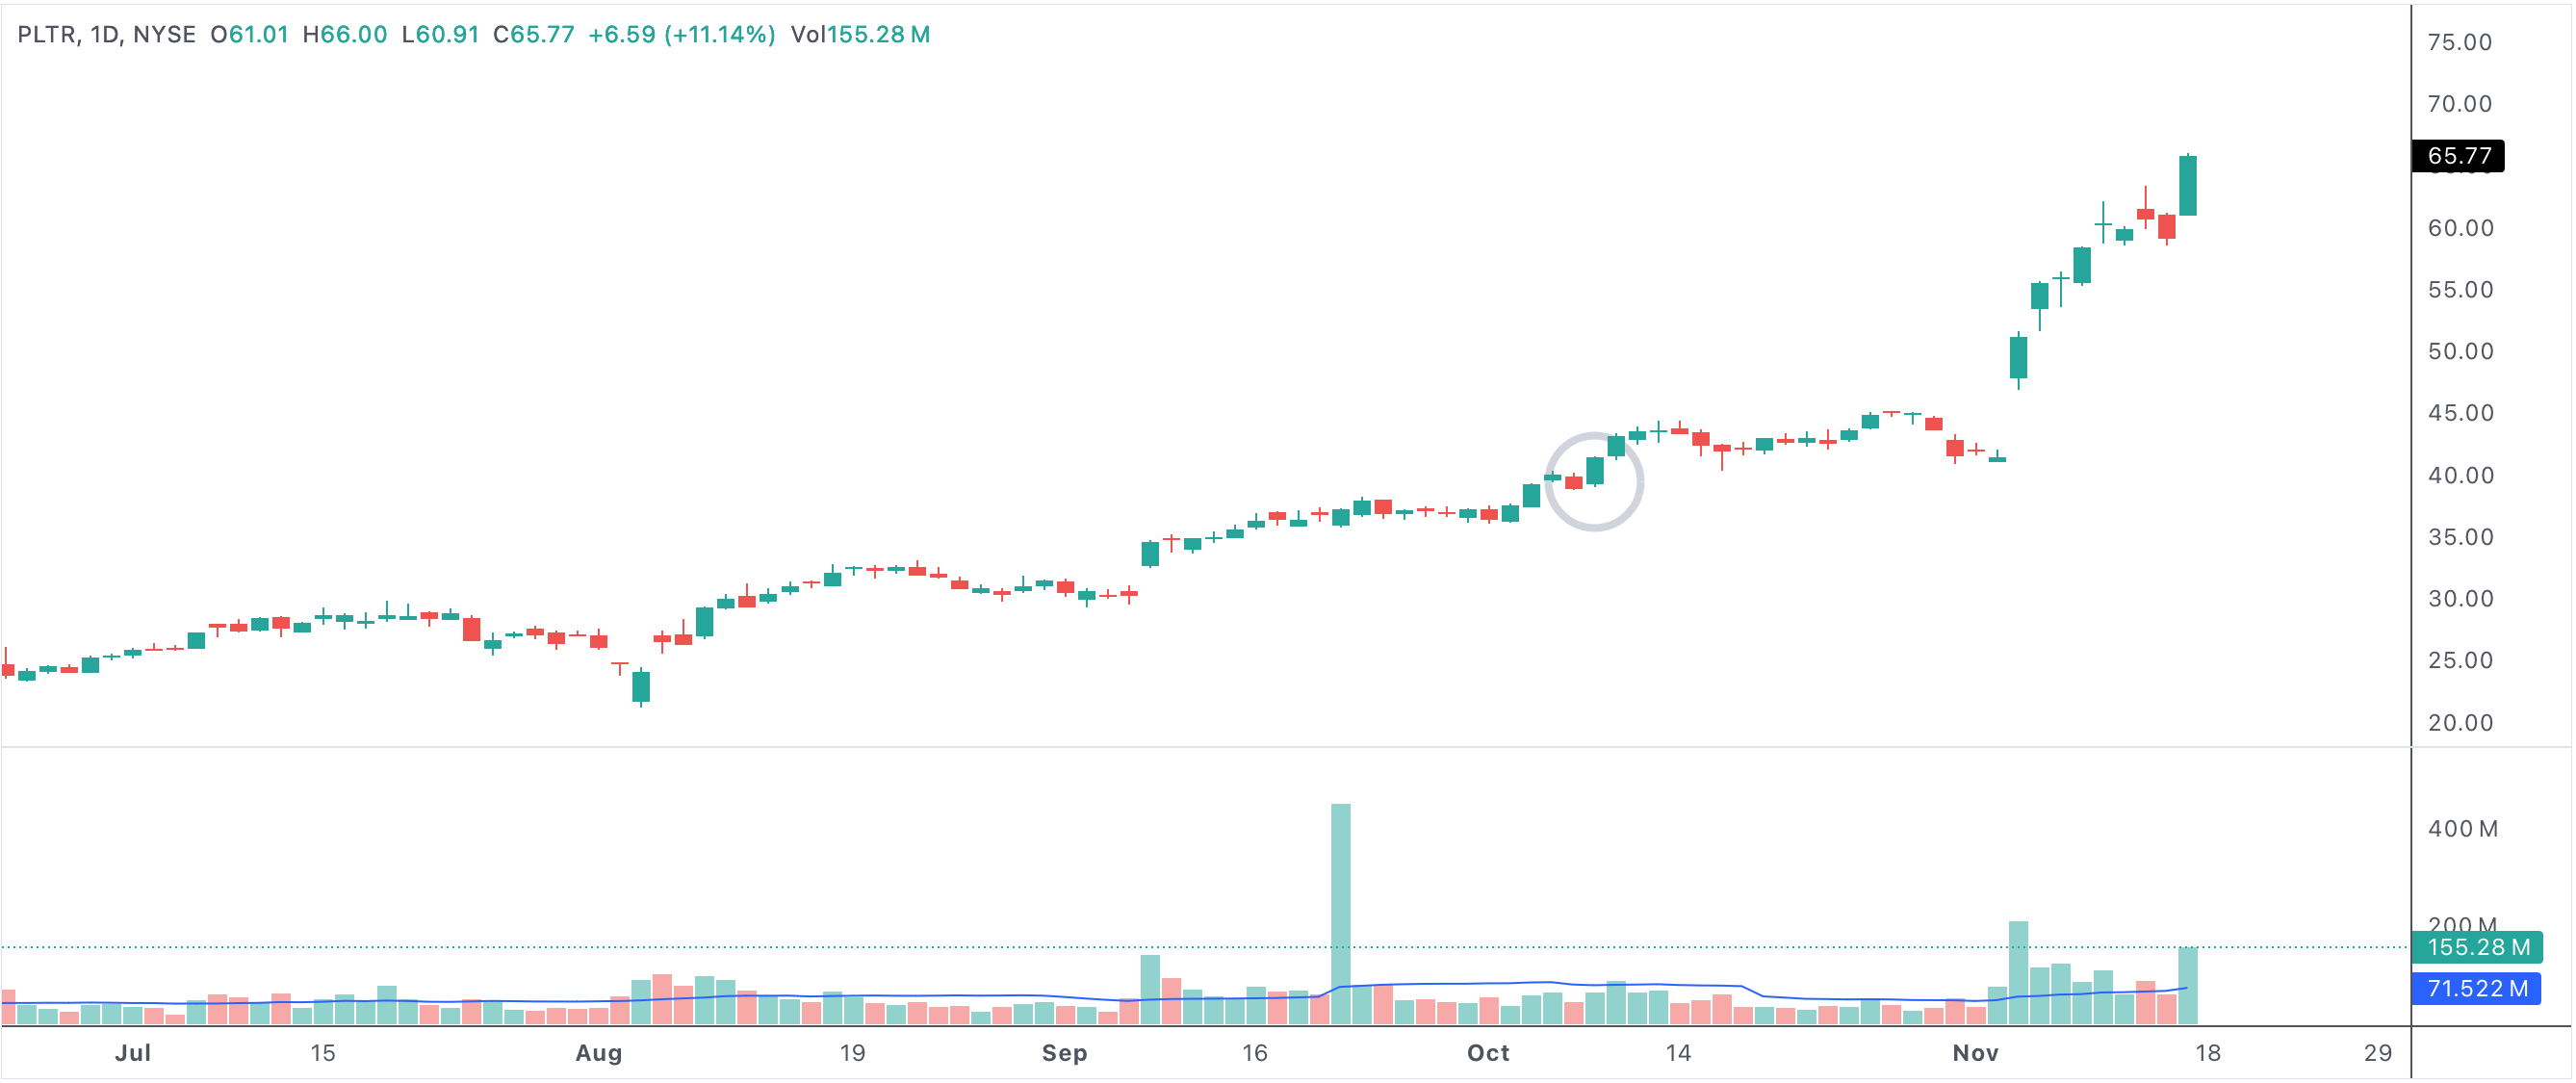
An example of a bullish 2-up breakout that follows through with a green close.
Red day followed by a bullish breakout 2-up with the bar itself green
Why This Pattern Matters
This setup is useful because both the breakout and the close point the same way. Buyers reversed the prior weakness, pushed price above the earlier range, and kept control into the close. That often makes it a stronger momentum signal than a mixed-color breakout bar.
The pattern can be especially interesting after a decline, near support, or after a short period of consolidation.
How Traders Use It
Some traders use this signal to find early bullish reversals. Others treat it as a continuation setup when it appears inside an already improving chart. The main value is identifying candles where the buying pressure looks decisive rather than tentative.
- The bullish 2-up breakout shows price expanding higher.
- A green close confirms buyers controlled the session.
- The setup is stronger than a bullish breakout that still closes red.
- This pattern is useful for spotting cleaner reversal and momentum moves.