Stochastic Oscillator Bearish Cross
A stochastic oscillator bearish cross happens when the %K line moves below the %D line, often signaling that short-term momentum is weakening. Traders watch this signal most closely when it appears after a rally or in overbought territory, because that is where a bearish cross is more likely to reflect a genuine loss of momentum rather than routine noise. Many traders compare it with the stochastic oscillator bullish cross, since the two signals frame opposite momentum shifts using the same indicator.
stochkcrossdownd
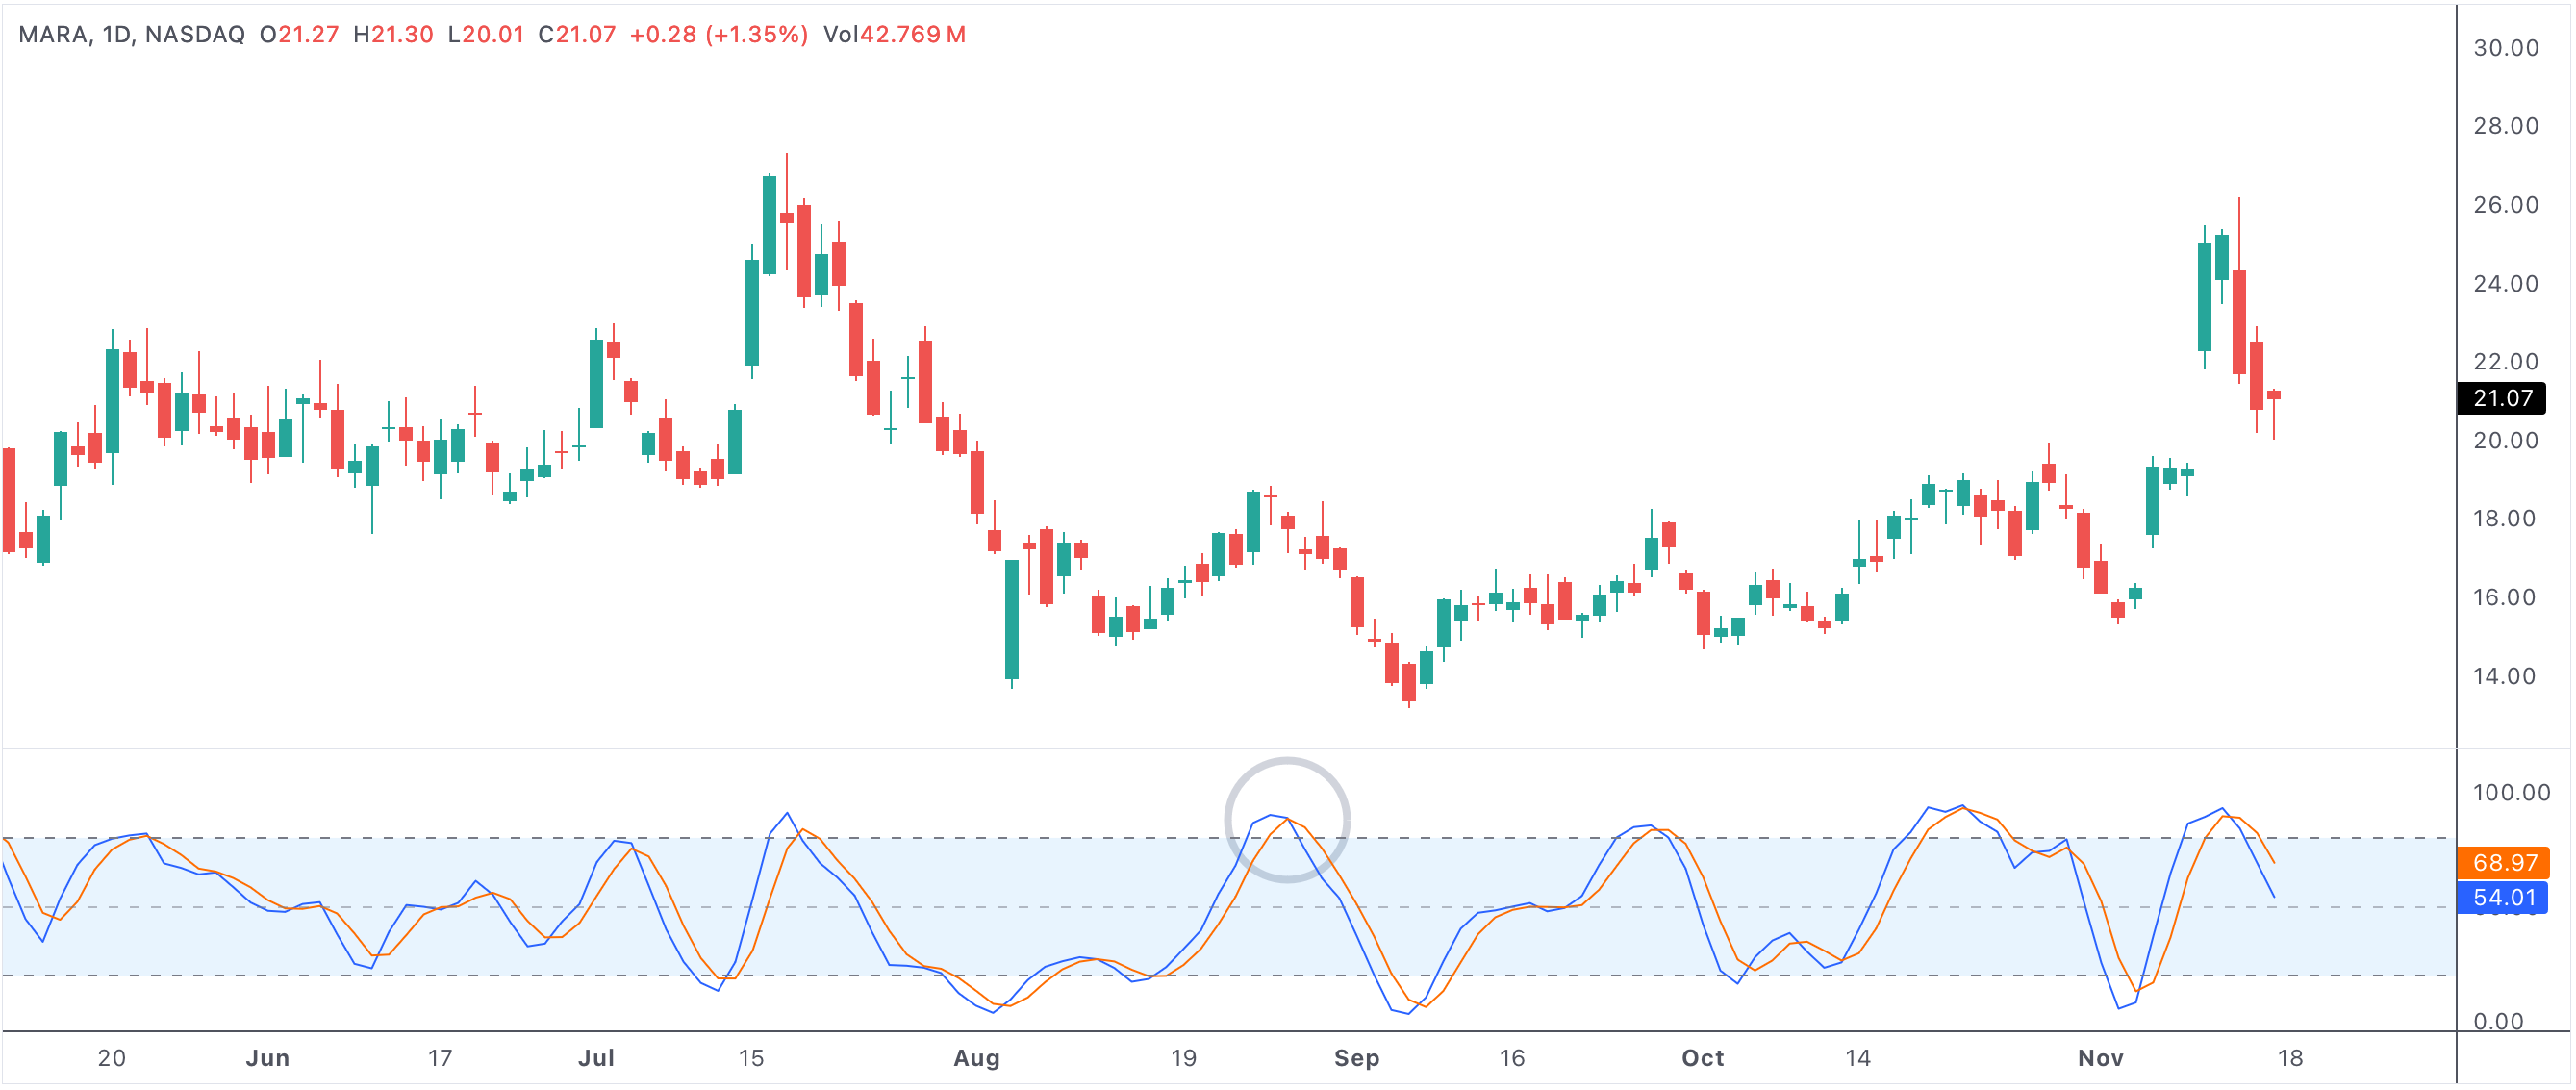
An example of a bearish stochastic crossover hinting at fading momentum.
Stochastic oscillator bearish cross
Why Traders Watch It
The stochastic oscillator compares closing price to the recent trading range. When %K crosses below %D, it can show that bullish momentum is weakening and that sellers are gaining more control over the short-term price rhythm. That can be useful for spotting early pullbacks, failed rallies, or reversal risk.
The setup is usually more meaningful when it appears after strength, near resistance, or in already stretched charts.
How Traders Use It
Some traders use this signal to tighten stops or reduce exposure in extended names. Others wait for price confirmation, such as a break below support or a lower high. The main value is recognizing early momentum deterioration before price damage becomes more obvious.
- A bearish stochastic cross can mark weakening short-term momentum.
- The setup often matters most after a rally or near overbought conditions.
- Price confirmation helps separate real weakness from indicator noise.
- This signal is useful for spotting early pullback or reversal risk.