Stocks Below the 10-Day SMA for the Longest Time
Stocks that stay below their 10-day simple moving average (SMA) for the longest consecutive stretch often show persistent short-term weakness. Because the 10-day SMA reacts quickly to price, remaining below it for many sessions usually means sellers have stayed in control and that bounce attempts have been weak. Traders often compare this setup with the first day back above the 10-day SMA after a long run below, since rebound signals become more meaningful after an extended stretch of weakness.
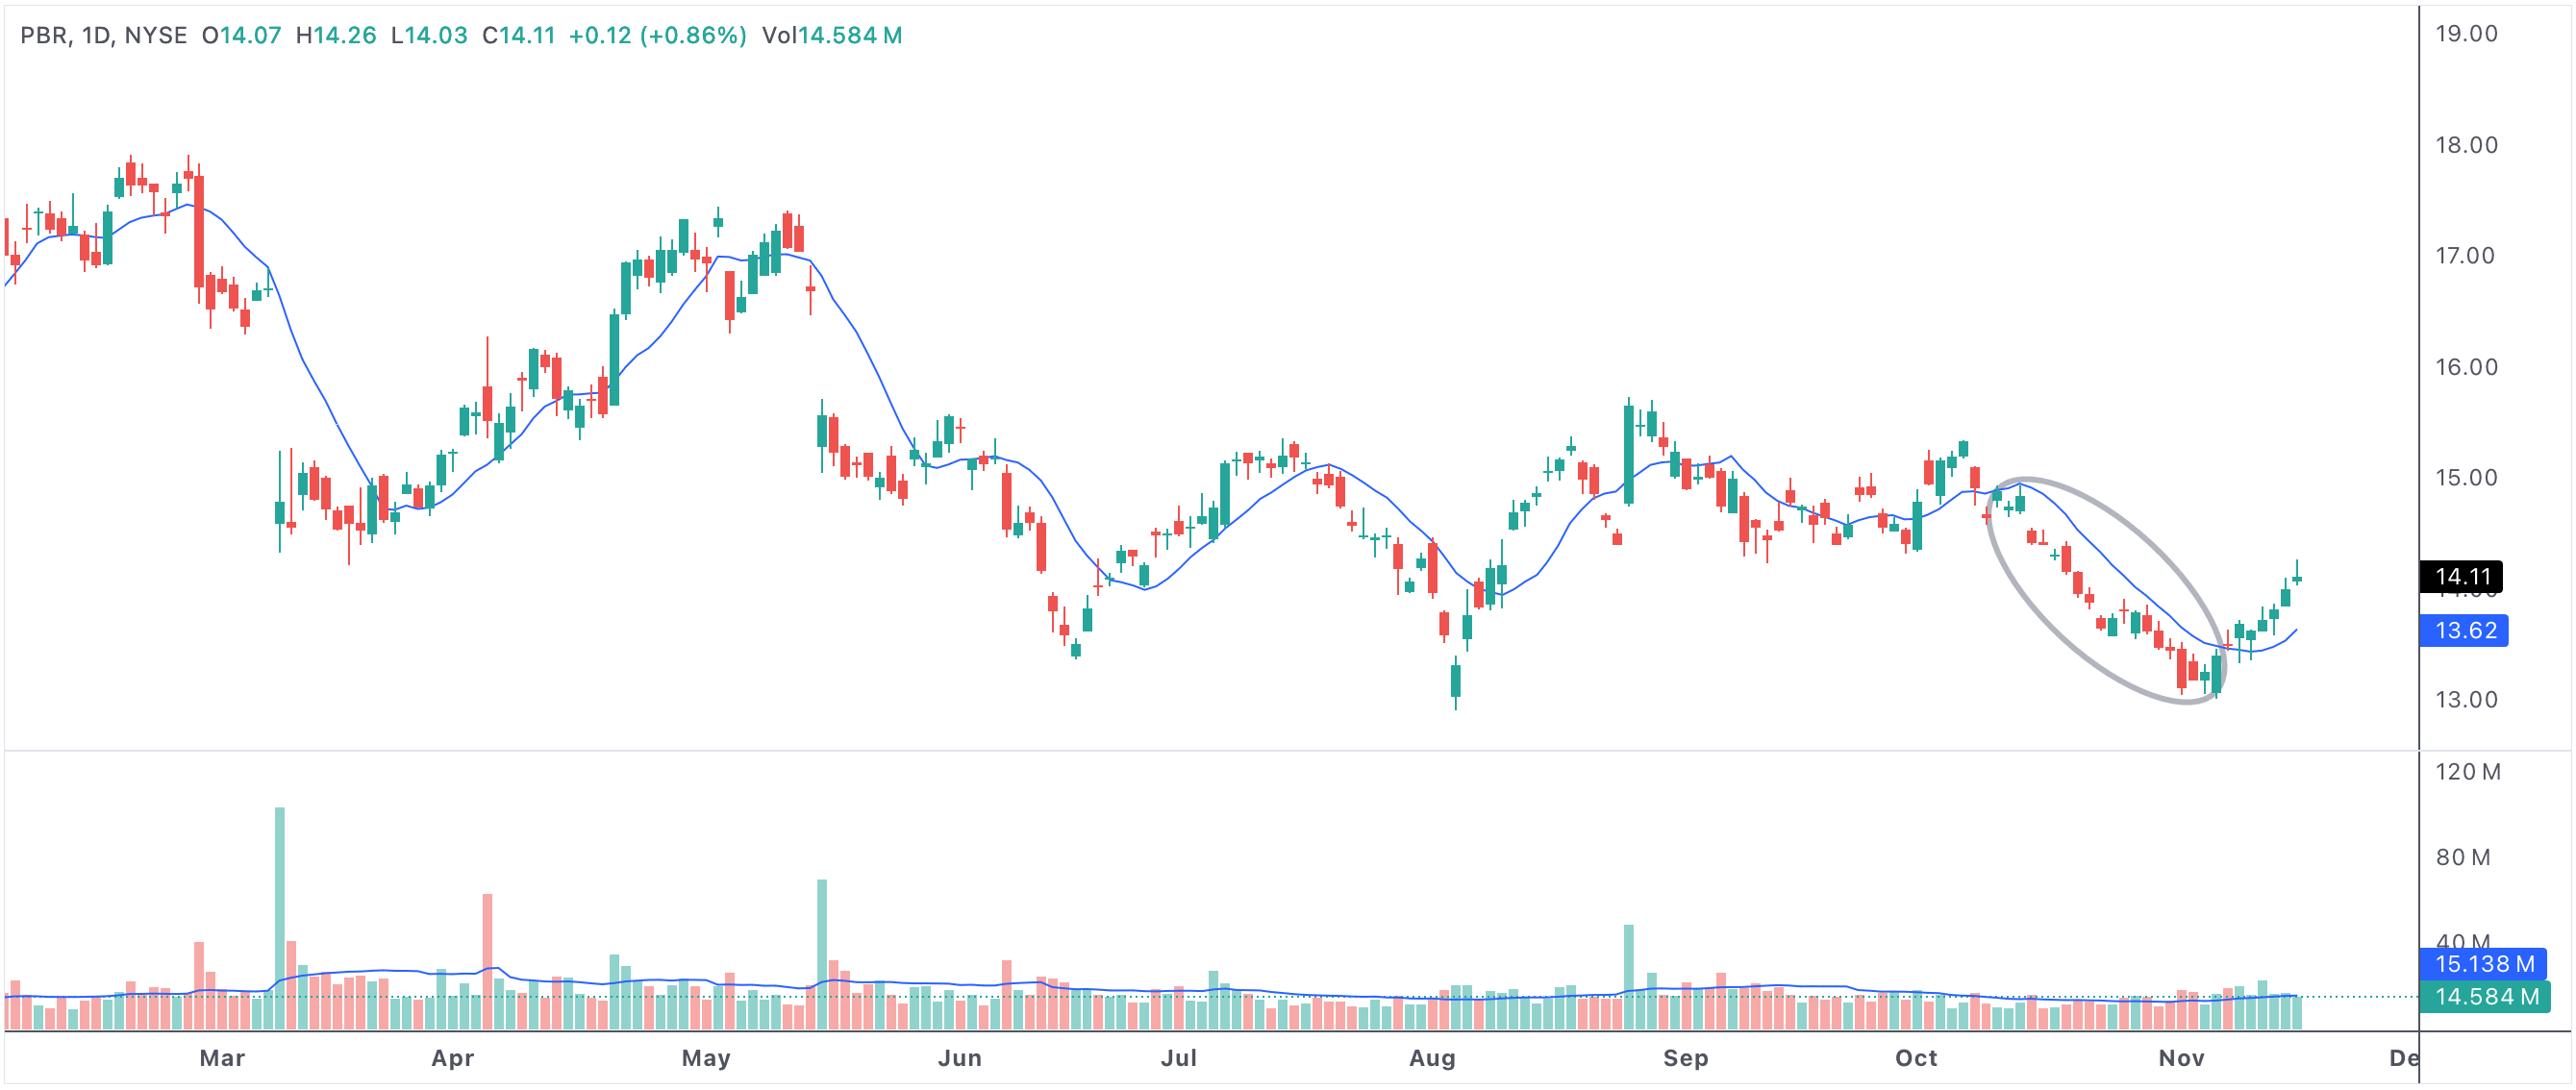
dayslt10sma
An example of a stock remaining below its 10-day SMA for an extended period.
Stocks below 10 SMA for longest consecutive days
Why This Matters
A long run below the 10-day SMA often reflects weak short-term momentum and a market that keeps rejecting recovery attempts. That makes this screen useful for identifying stocks still under pressure, especially during fast-moving declines or weak market phases.
Because the average is so short-term, long streaks below it can also help highlight names that may eventually be approaching exhaustion.
How Traders Use It
Some traders use this list to avoid weak charts until momentum improves. Others use it to watch for oversold bounce candidates once price starts to stabilize. The key is knowing whether the stock is still deteriorating or beginning to repair.
- Long streaks below the 10-day SMA often signal persistent short-term weakness.
- The screen helps identify names that are still under selling pressure.
- It can also point to stocks nearing washout conditions.
- This setup is most useful when paired with price confirmation and support levels.