Stocks Furthest Below the 200-Day SMA
Stocks trading far below their 200-day simple moving average (SMA) often represent some of the most washed-out long-term charts in the market. The deeper the distance below the 200-day SMA, the more extreme the breakdown has usually been. That can signal serious trend damage, but it can also identify the kinds of oversold names traders study for eventual rebound opportunities. A closely related screen is stocks furthest below the 50-day SMA, which shows a similar idea over a shorter trend horizon.
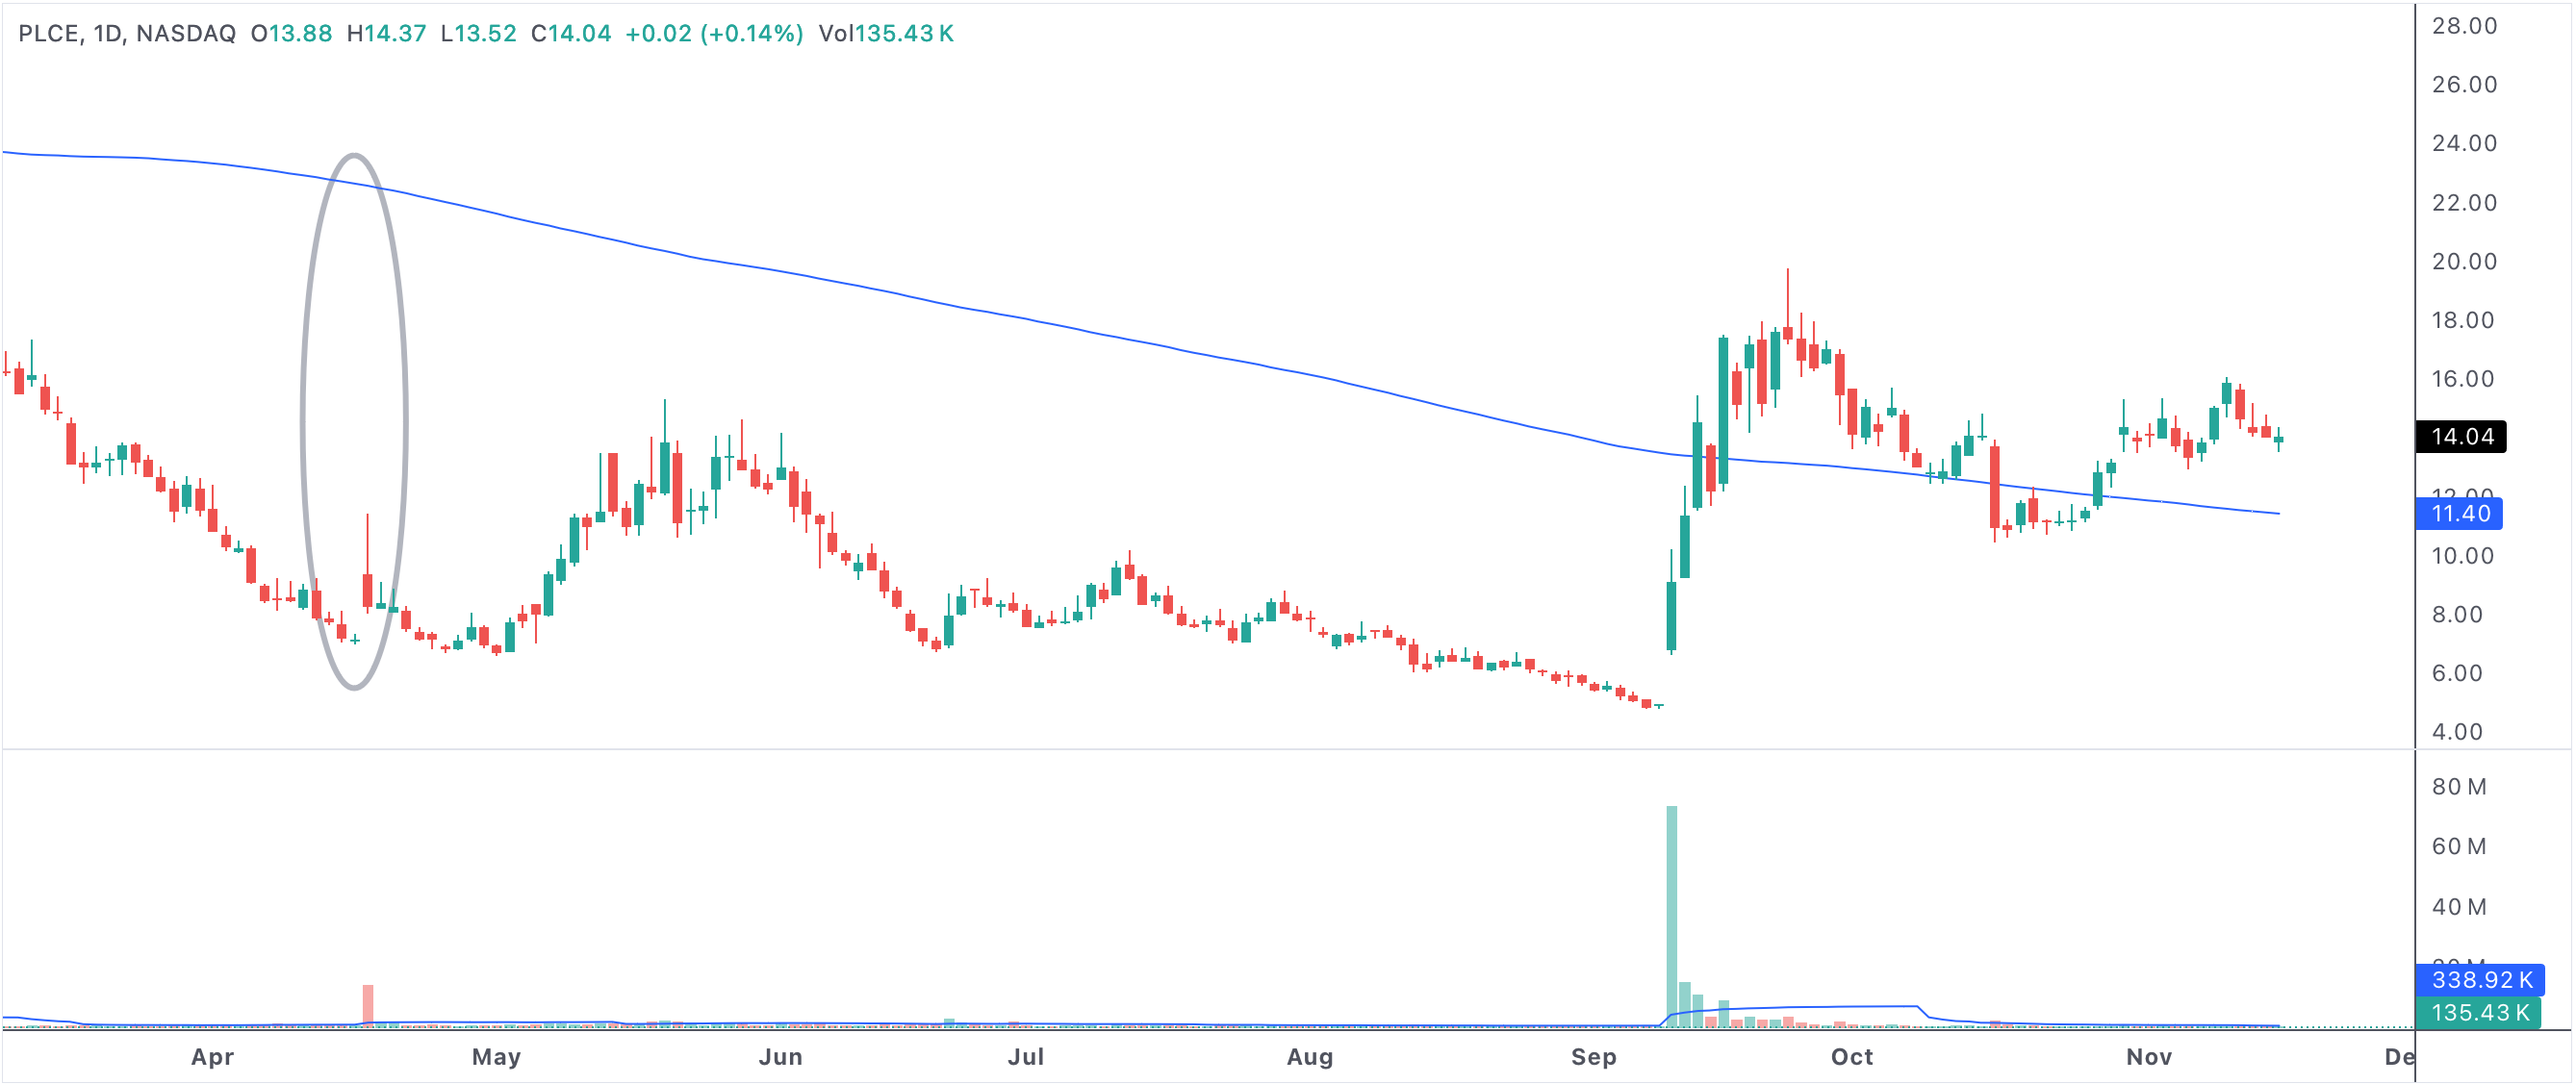
below200sma
An example of a stock trading far below its 200-day SMA after a major decline.
Stocks with highest % below the 200 SMA
Why The 200-Day SMA Matters
The 200-day SMA is one of the clearest measures of long-term trend health. When a stock trades far beneath it, the market is signaling more than just a routine pullback. The move is usually large enough to reflect a broken trend, broad pessimism, or both.
That is why this screen can be useful in two different ways: to identify the weakest long-term charts, or to find names that may eventually offer a powerful mean-reversion move once selling pressure fades.
What Traders Need To Confirm
The percentage below the 200-day SMA should not be used alone. Traders still need to understand whether the stock is stabilizing, whether support is nearby, and whether there is any sign that the downtrend is slowing. Without that context, a deeply oversold stock can simply remain weak.
- Far below the 200-day SMA often signals major long-term weakness.
- The screen can help find both risk and opportunity at extreme levels.
- Stabilization, support, and volume are more important than the percentage alone.
- This setup works best as a research starting point, not a standalone entry signal.