Stocks Furthest Below the 50-Day SMA
Stocks trading far below their 50-day simple moving average (SMA) often stand out because they have become stretched relative to their intermediate trend. That can signal deep weakness, but it can also create oversold rebound opportunities when selling becomes exhausted. Traders often compare this condition with stocks furthest below the 200-day SMA, since both scans are designed to surface names that have moved well beneath a widely watched trend line.
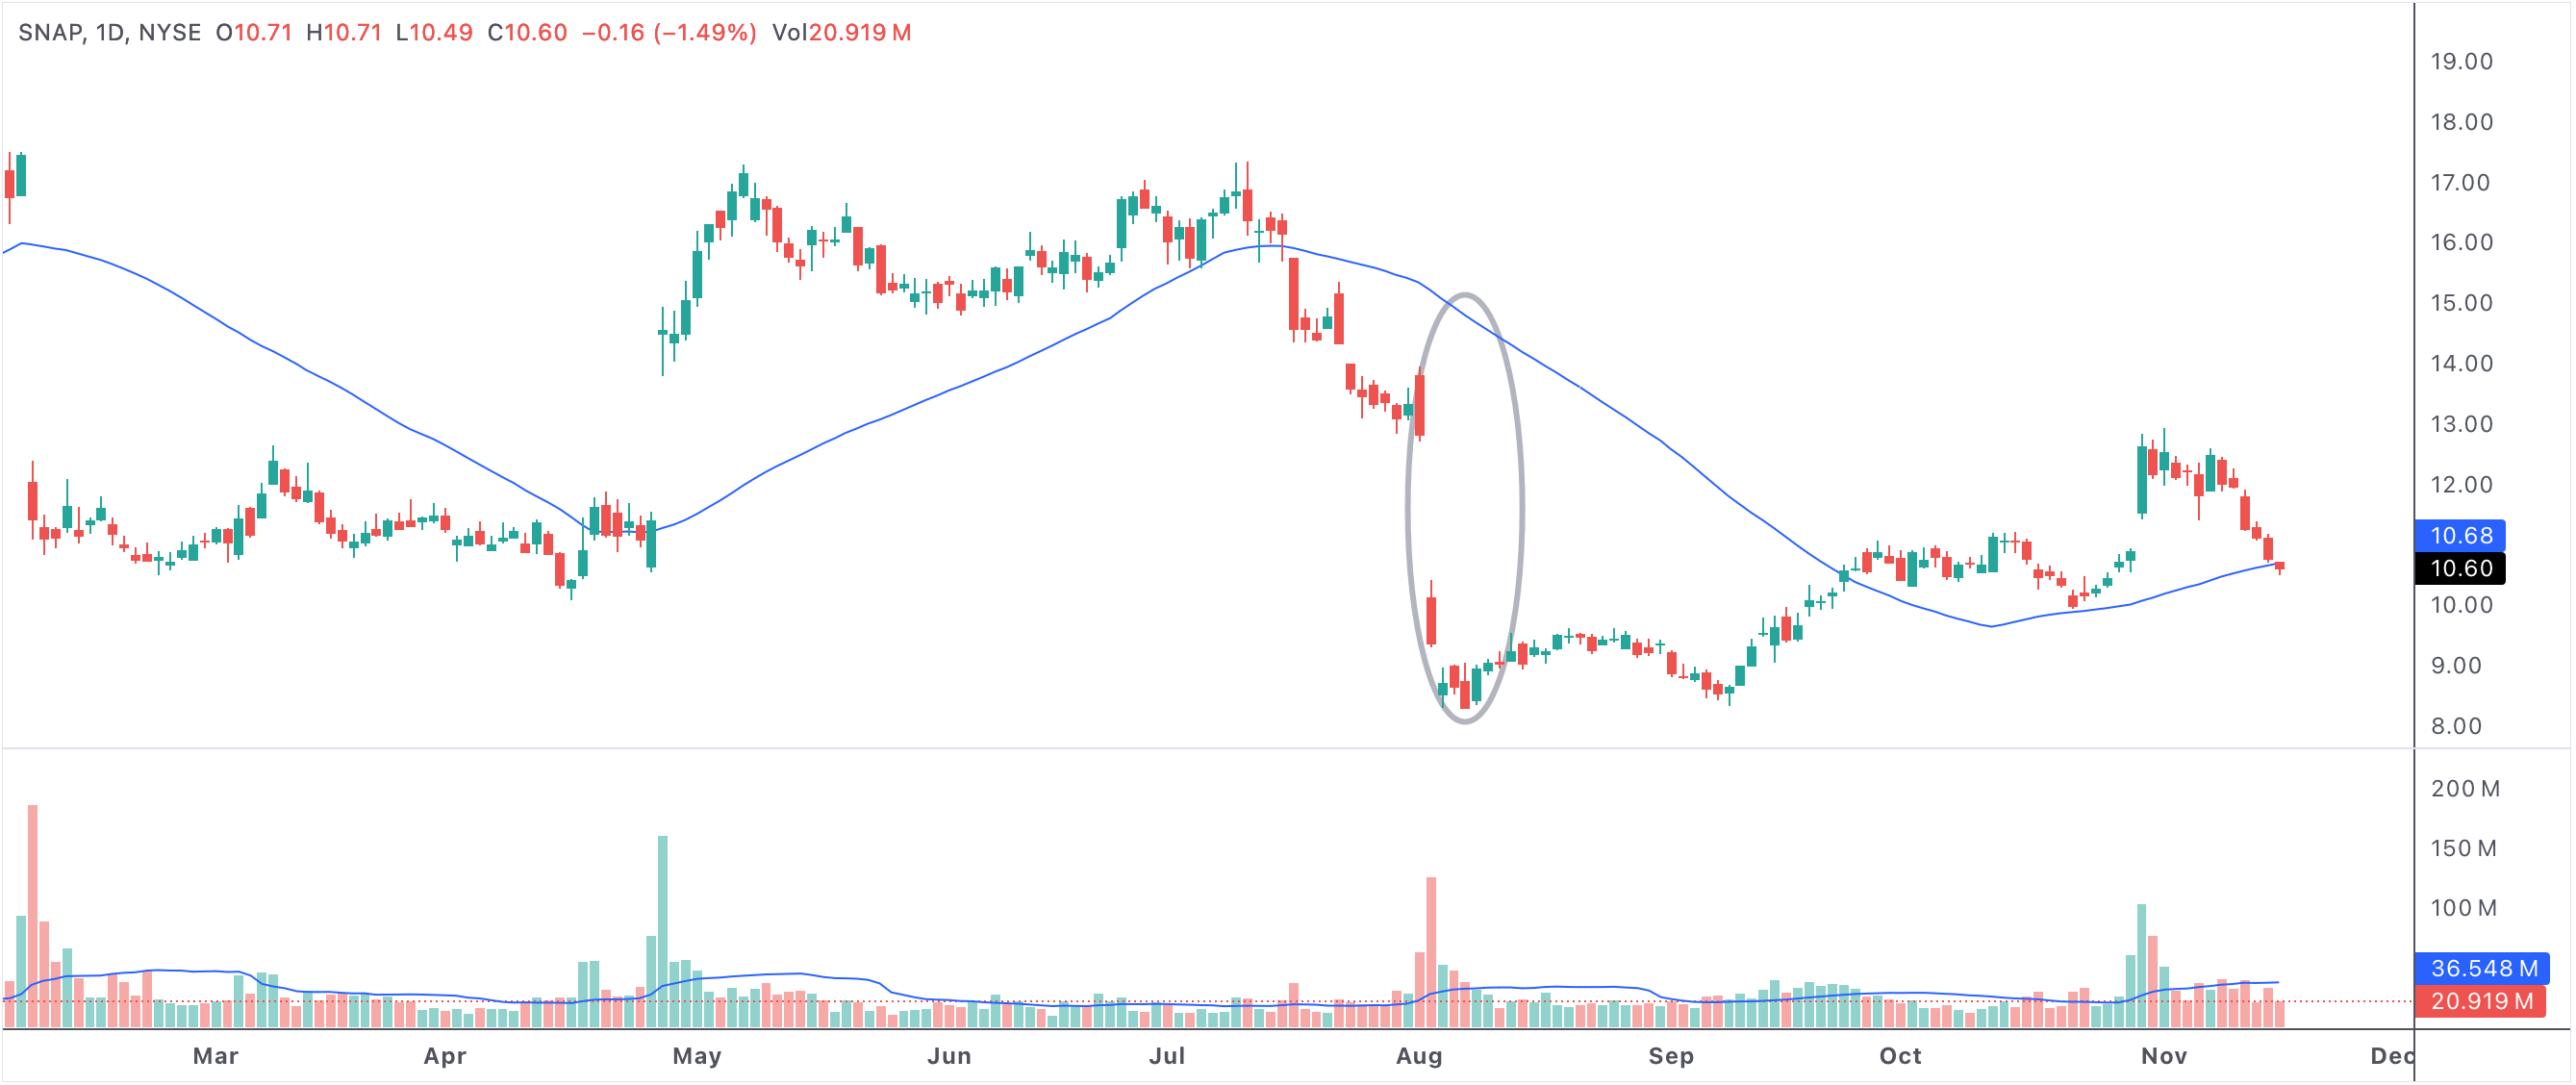
below50sma
An example of a stock trading far below its 50-day SMA after a sharp decline.
Stocks with highest percent below the 50 SMA
Why The 50-Day SMA Matters
The 50-day SMA is one of the most common measures of the intermediate-term trend. When a stock trades well below it, the market is signaling that price has fallen materially under its recent average. In some cases that reflects serious weakness and a damaged chart. In other cases it marks a stock that has become washed out enough to attract bargain hunters or short-covering.
The size of the gap below the 50-day SMA matters because extreme distance often signals an unusual move rather than normal trend fluctuation.
What Traders Look For Next
This screen works best as a starting point. Traders usually want to know why the stock became so stretched, whether support is nearby, and whether momentum is still deteriorating. A stock can stay far below its 50-day average for a long time, so the scan is not automatically bullish on its own.
- Far below the 50-day SMA can indicate oversold conditions or serious trend damage.
- Context determines whether the setup is a rebound candidate or a stock to avoid.
- Volume, support, and the reason for the selloff matter more than the percentage alone.
- The best opportunities usually appear when weakness starts to stabilize.
How This Scan Is Used
Some traders use this list to hunt for mean-reversion bounces. Others use it to study the weakest charts in the market and avoid them until price improves. In both cases, the screen is most effective when paired with price action, support levels, and a clear plan for managing risk.