Stocks With the Highest Relative Trading Volume - Relative Volume Breakout Signals
Stocks with the highest relative trading volume often show where the market's attention is going right now. Relative volume compares current volume with a stock's normal trading activity, so a high reading can point to unusual demand, news-driven interest, or the beginning of a breakout. Traders frequently compare this scan with RSI Crossed Above 70 when they want to see whether volume expansion is also being confirmed by strong momentum.
Why Relative Volume Matters
Relative volume helps traders answer a simple question: is this move attracting more participation than usual? A stock can rise on light volume and fail quickly, but a move backed by heavy relative volume often carries more conviction. That is why breakout traders, momentum traders, and even longer-term investors pay close attention when volume spikes well above average.
Relative Volume Breakout Example
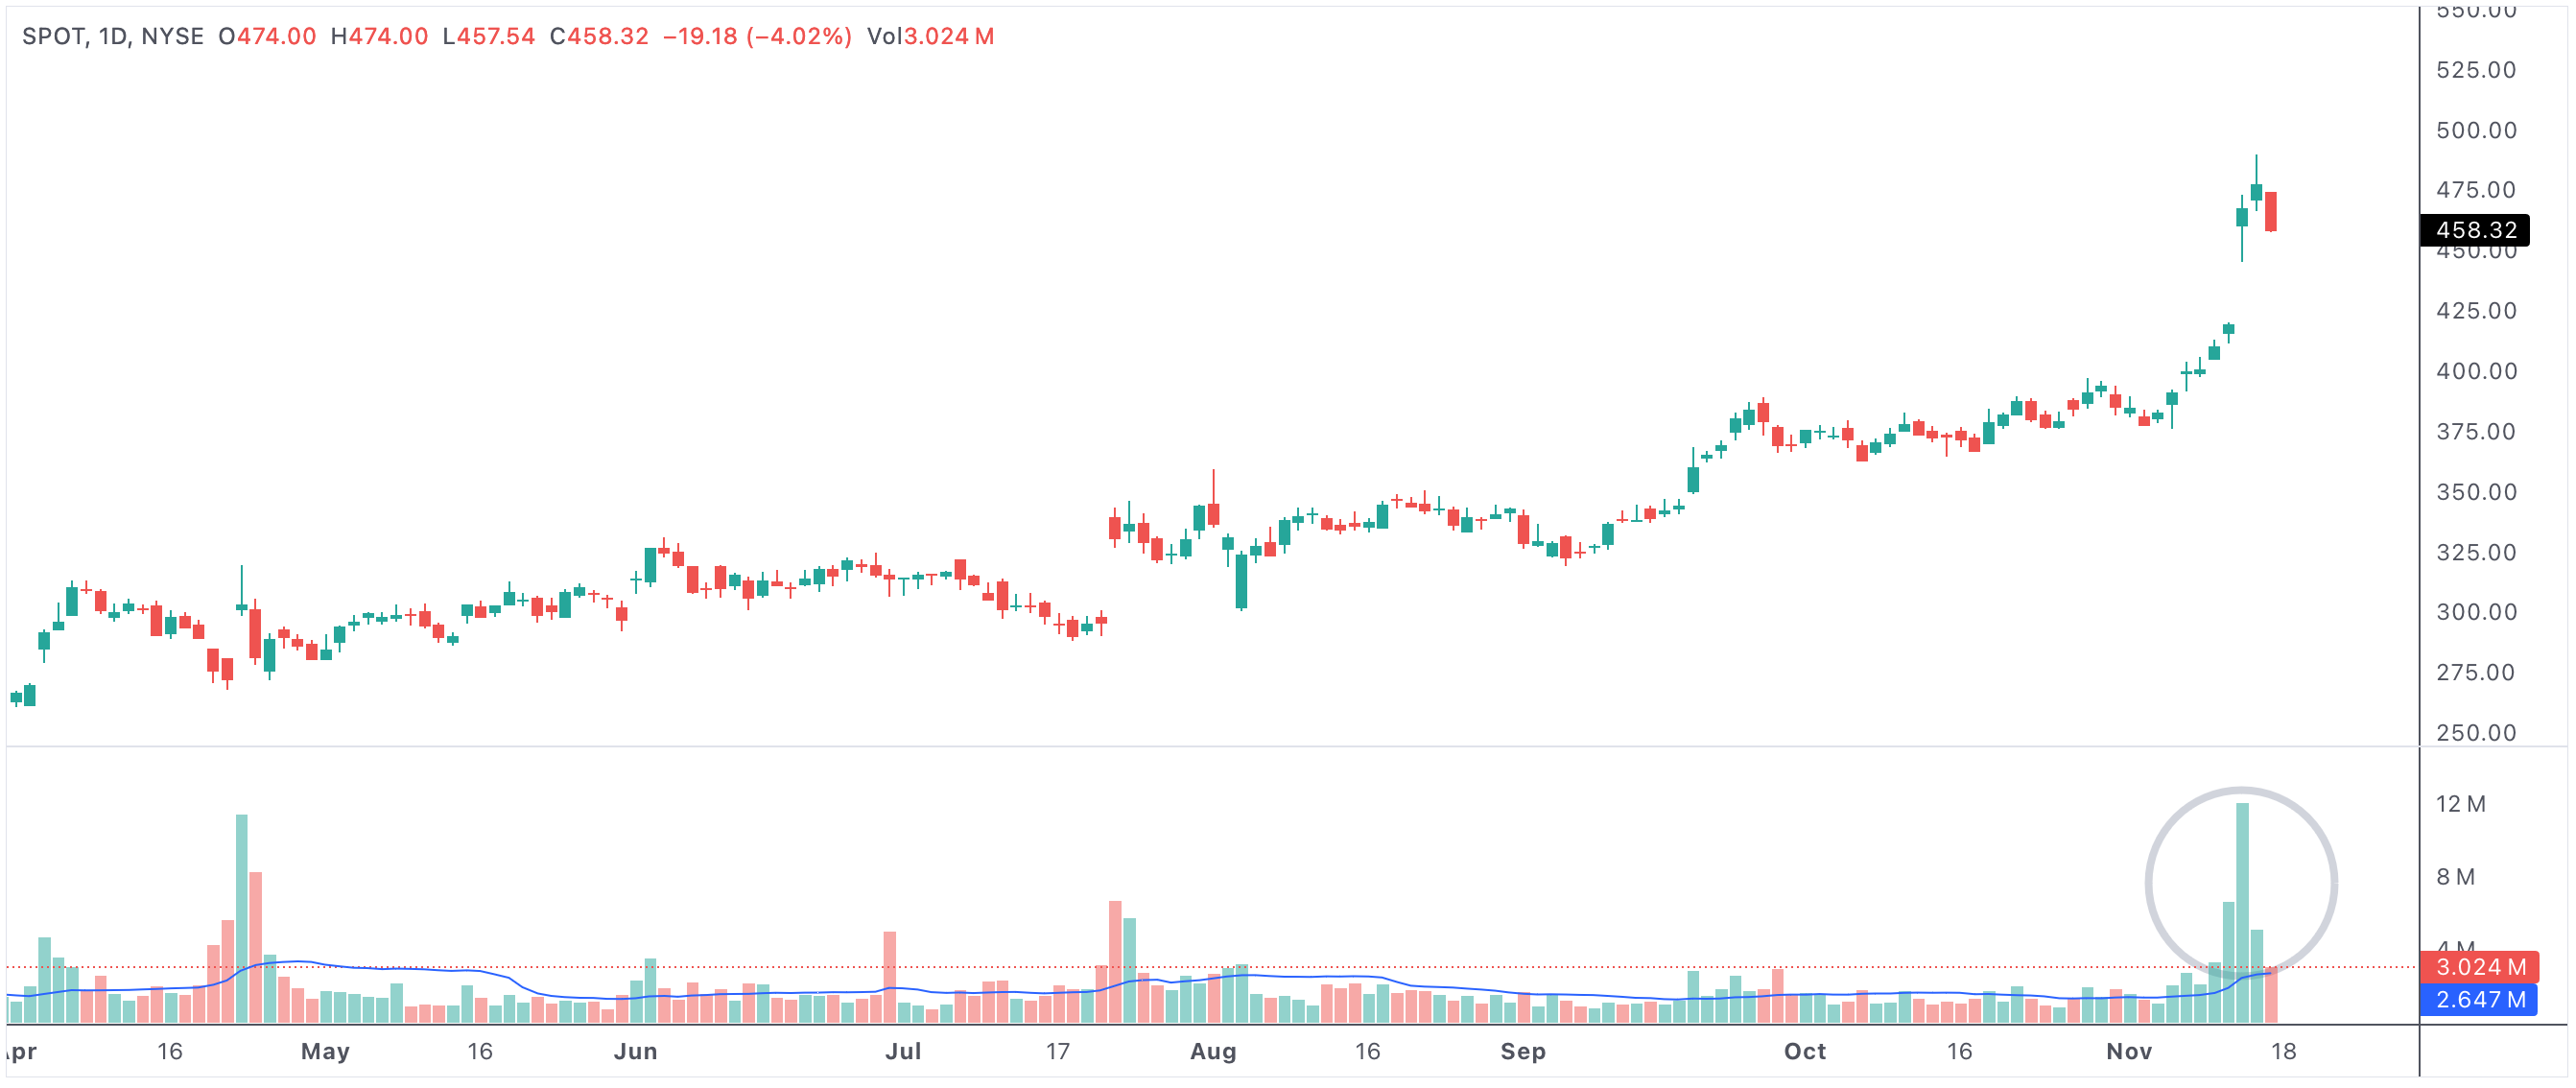
This chart shows a stock with price surging on higher-than-average volume, often a signal of strong buying conviction and the start of a new move.
Highest relative trading volume
What High Relative Volume Can Signal
High relative volume can show several things at once: that institutions are getting involved, that a catalyst has changed expectations, or that a stock is beginning to separate from a prior trading range. When price and volume expand together, the move tends to be more meaningful because buyers are proving that they are willing to commit capital at the new levels.
This does not automatically make every high-volume stock bullish. Sometimes relative volume increases because of bad news, a gap down, or forced selling. That is why traders always read volume together with price direction and chart structure.
How Traders Use Relative Volume
Many traders use relative volume as a filter first and a decision tool second. They scan for the highest relative volume names, then evaluate which ones are breaking out, reclaiming moving averages, or showing strong trend continuation. If the price move is clean and the volume is exceptional, the stock often moves onto a watchlist very quickly.
- Relative volume shows whether a stock is trading with unusually high participation.
- High volume on price strength can confirm breakouts and momentum moves.
- High volume on price weakness can signal distribution or panic selling instead.
- This scan helps traders find the stocks that are actually in play right now.
- Relative volume works best when paired with chart structure, momentum, and catalyst awareness.
Why This Scan Is Valuable
For active traders, relative volume is one of the fastest ways to focus on the names that matter most each day. It surfaces stocks with fresh participation, changing sentiment, and the potential for larger-than-normal moves. Used with price action and risk management, it can be one of the most practical scans for finding breakout candidates and momentum leaders.