Stocks With the Highest Volume Accumulation Over the Last 50 Days
Stocks with the highest volume accumulation over the last 50 days can stand out because persistent buying volume often appears before or during strong price trends. A longer accumulation window helps filter out one-day spikes and instead highlights names that have seen sustained demand over many sessions. Traders often compare this list with the 5-day volume accumulation version, since the shorter scan is more reactive while the 50-day view captures a broader accumulation trend.
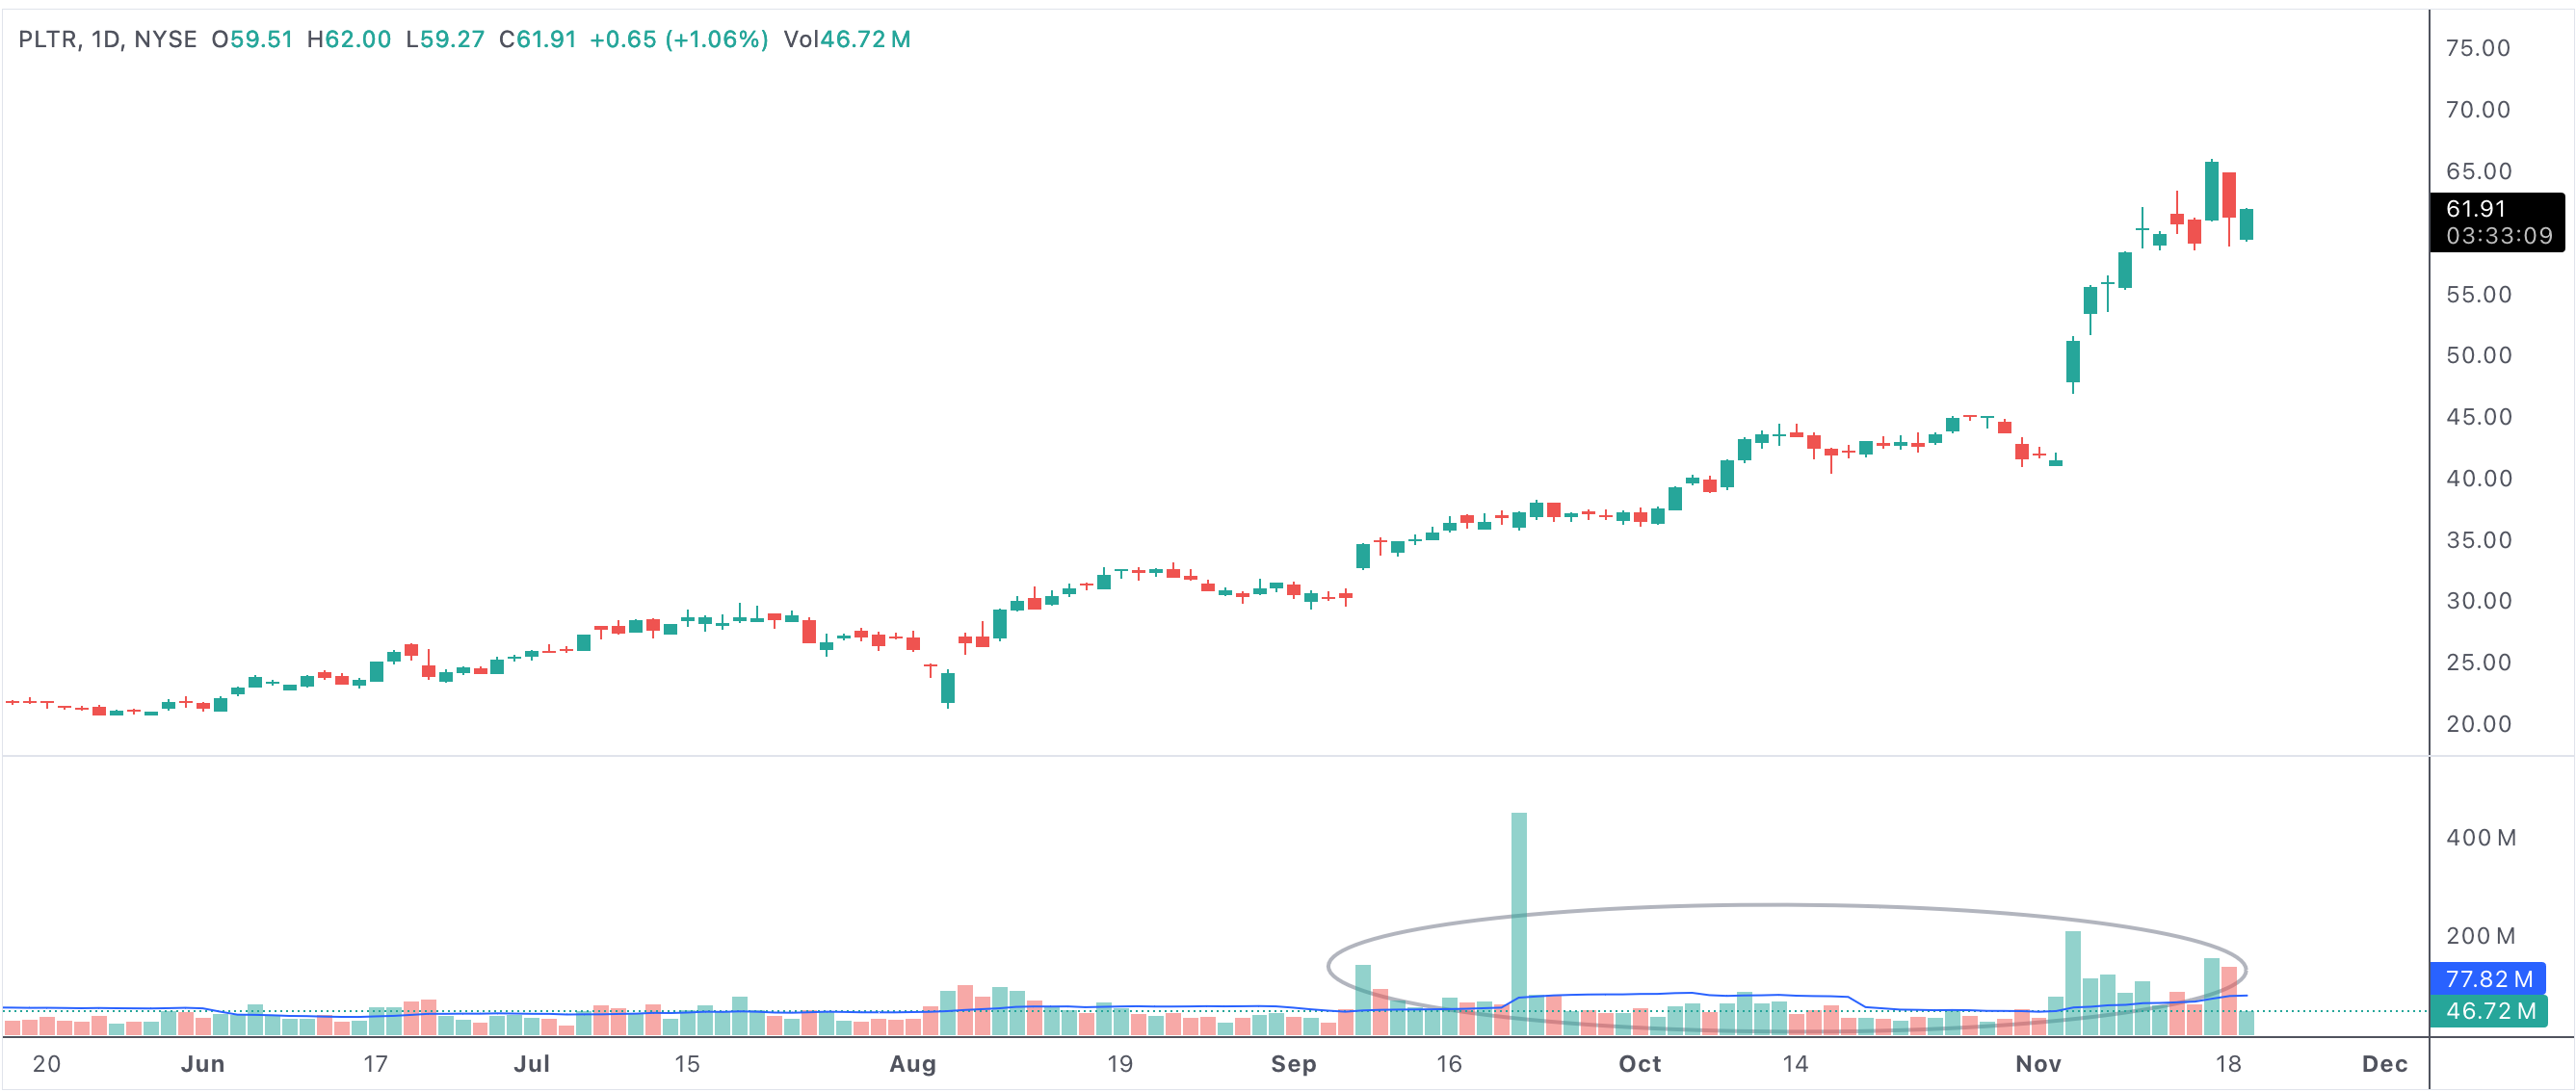
fiftydayvolumesurge
An example of a stock showing strong buying volume over the last 50 days.
Stocks with the highest volume accumulation in the last 50 days
Why A 50-Day Window Helps
Volume accumulation becomes more meaningful when it persists. Over 50 trading days, repeated positive volume can suggest institutional interest, continued sponsorship, or steady demand that supports a larger move. That makes this screen useful for finding stocks that may be building a base or already trending with real participation.
Not every high-volume stock is bullish, though. The price trend still matters. Accumulation is most useful when the chart also shows constructive price behavior.
How Traders Use It
Some traders use this screen to find stocks quietly being accumulated before a breakout. Others use it to confirm that a move already underway is supported by sustained participation. In both cases, the goal is to find names where the volume story supports the price story.
- 50-day volume accumulation can highlight sustained demand, not just short-term noise.
- The longer lookback often surfaces stronger institutional-style participation.
- Price structure still determines whether the setup is constructive.
- This screen works well for finding stocks worth deeper chart review.