Strong Momentum and Relative Strength - RSI Above 70
Strong momentum and relative strength are often most visible when RSI rises above 70. While some traders immediately label RSI above 70 as overbought, the stronger interpretation is often that the stock is under heavy accumulation and outperforming weaker names. In that sense, this setup is frequently more about leadership than exhaustion. Traders often compare it with Highest Up Volume In A Single Day to see whether strong momentum is also being backed by exceptional participation.
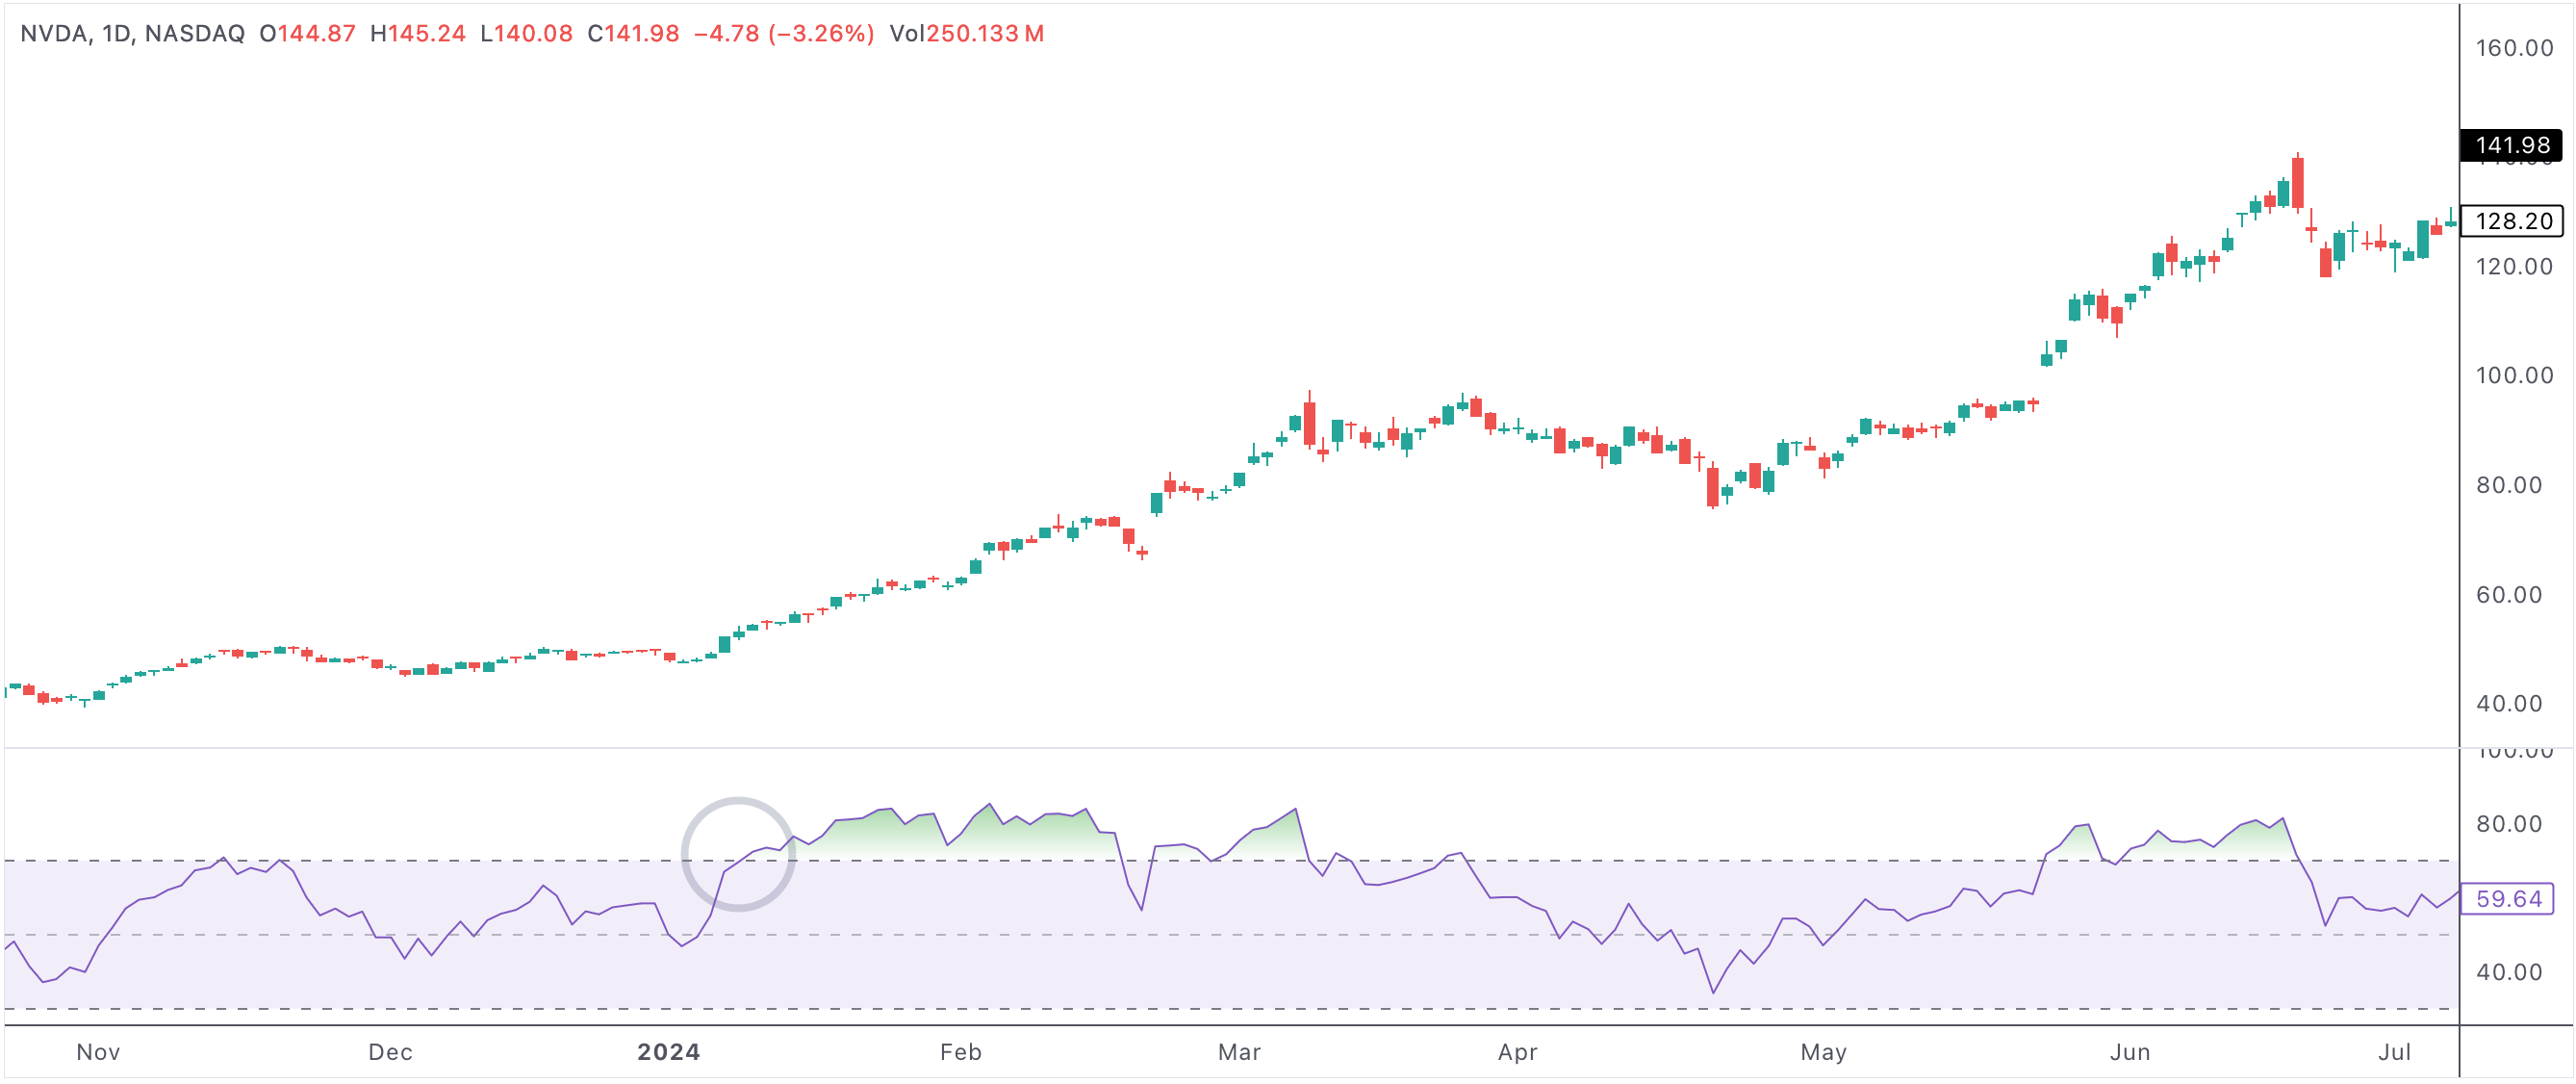
rsicrossup70
An example of a stock with the RSI crossing above 70.
RSI crossing above 70 signals strong momentum and possible bullish sentiment
What RSI Above 70 Actually Means
The Relative Strength Index measures the balance between recent gains and losses. When RSI moves above 70, it tells traders that upside momentum has become unusually strong. In weak or choppy markets, that can precede a pullback. But in strong trends, an RSI above 70 often identifies stocks with real leadership and sustained buying pressure.
Momentum Versus Overbought
One of the most common mistakes in technical analysis is assuming that every high RSI reading is automatically bearish. In reality, strong stocks can stay overbought for longer than many expect. A high RSI can simply mean the stock is acting better than its peers, attracting capital, and continuing to trend.
That is why context matters. If price is breaking out cleanly, volume is supportive, and the broader market is healthy, RSI above 70 often confirms strength rather than warning of immediate weakness.
- RSI above 70 often marks strong momentum and relative strength.
- High RSI does not always mean a reversal is near.
- The best setups usually have supportive price action and volume.
- Strong momentum names often become market leaders and trend continuation candidates.
- Traders should still watch for divergence or failed breakout behavior.
How Traders Use This Signal
Momentum traders often use RSI above 70 to narrow their focus to the strongest names in the market. They may buy breakouts, trend continuation pullbacks, or stocks consolidating near highs. Other traders use the signal as confirmation rather than an entry by itself. Either way, the value comes from identifying where the strongest buying pressure already exists.
As always, risk management matters. Strong stocks can still reverse sharply. But when used properly, RSI above 70 can be a very effective way to find stocks with genuine leadership and above-average momentum.