Bearish Candle Followed by Bullish Inside Day: Redgreeninside Reversal Signal
The Bullish Harami pattern—a bearish candle followed by a bullish candle that forms an inside day—is a well-known candlestick formation used by technical traders to identify potential reversal opportunities in the stock market. When observed after a downtrend, the Bullish Harami is interpreted as a signal that selling pressure may be easing, and a bullish reversal could be in the making. This pattern attracts the attention of price action traders and is often confirmed with other technical indicators to increase its reliability.
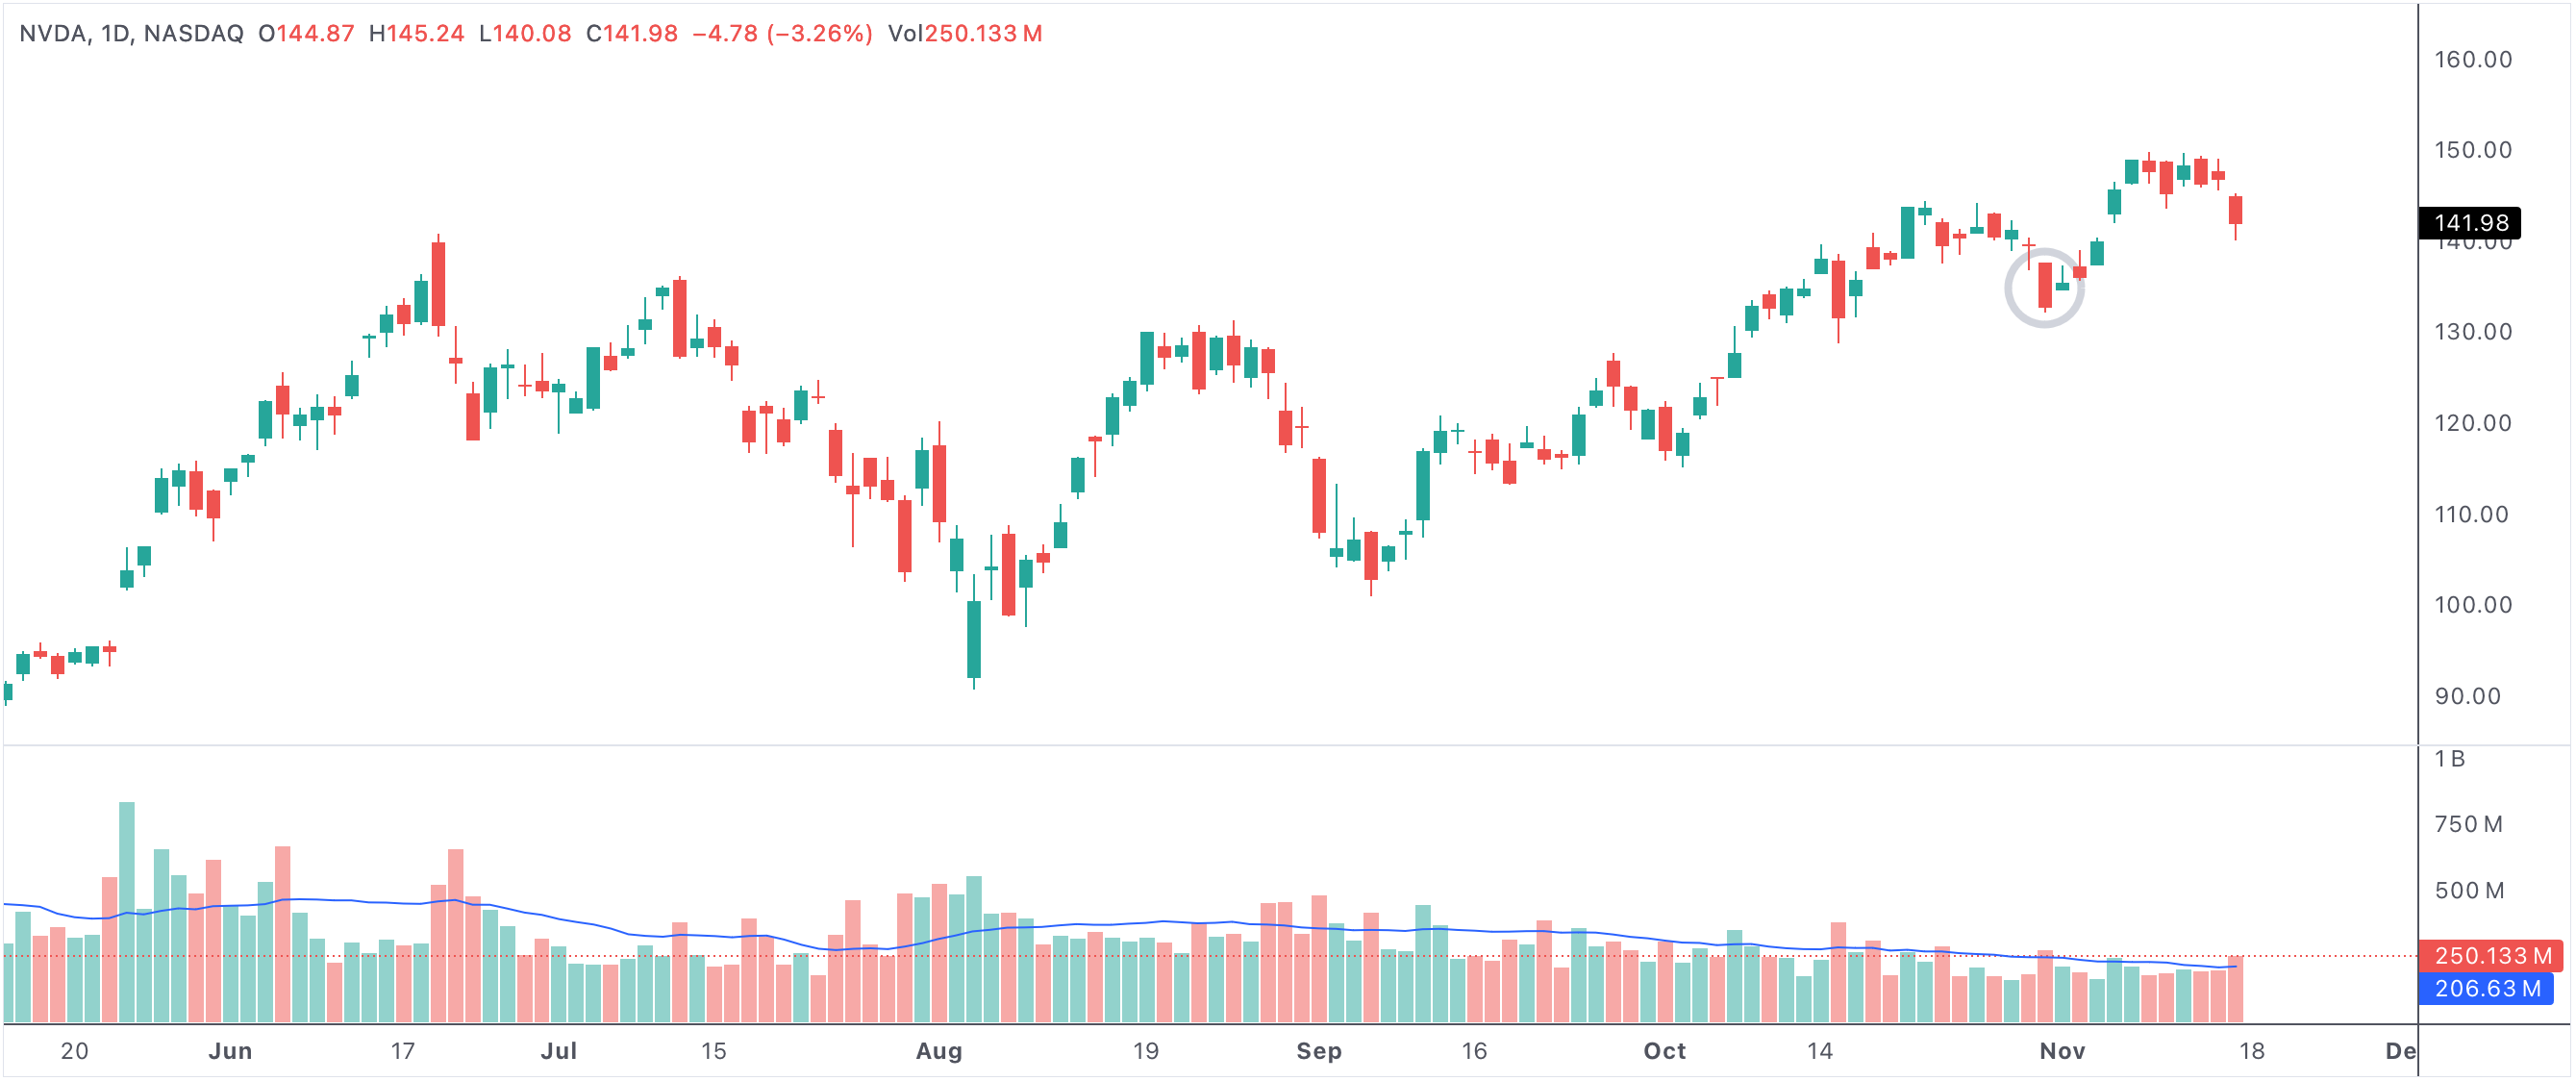
bullishharami
An example of a stock with a bearish candle followed by a bullish candle that is an inside day (Bullish Harami)
A bearish candle followed by a bullish candle that is an inside day
Understanding the Bullish Harami Pattern
The Bullish Harami candlestick pattern consists of two candles. The first is a strong bearish candle representing aggressive selling and negative sentiment. The second is a smaller bullish candle whose open and close are contained within the body of the previous bearish candle, making it an "inside day." This smaller candle suggests that the momentum of the sellers is diminishing, and buyers are starting to cautiously step in. The word "Harami" means "pregnant" in Japanese, with the first candle symbolizing the mother and the inside bullish candle representing the child—an apt metaphor for a new trend being born from the prior move.
Why Is the Bullish Harami Important?
The Bullish Harami is important because it signals a pause or potential shift in sentiment after a strong decline. It’s particularly significant when it appears at or near established support levels, or after several consecutive bearish sessions. The contraction in price range from the first to the second candle reflects indecision and a battle between buyers and sellers. The inside bullish candle implies that sellers may be losing control, and this uncertainty can pave the way for buyers to begin building momentum for a reversal.
Trading Implications and Confirmation
Traders often look for confirmation after spotting a Bullish Harami. A common approach is to watch for the price to break above the high of the bullish inside day on the next session. This move, especially if accompanied by increased volume, provides confirmation that buyers are stepping up and a reversal may be underway. Some traders will further support their analysis by checking other indicators such as RSI, MACD, or moving averages, or by identifying the pattern near oversold conditions.
Risk management is critical when trading this pattern. Many traders place stop-loss orders just below the low of the inside candle, limiting downside in case the reversal fails and the trend continues downward. The Bullish Harami is not a guarantee of a reversal, but its presence can help traders better time their entries in anticipation of a change in trend.
The Psychology Behind the Pattern
The Bullish Harami pattern reflects a transition in market psychology. The strong bearish candle demonstrates overwhelming selling pressure, while the subsequent smaller bullish inside candle shows a significant reduction in downside momentum. This inside day indicates that the selling has slowed and buyers are starting to test the waters. If more buyers join in after the pattern is confirmed, it can trigger additional demand, leading to higher prices and a new bullish phase.
Best Market Conditions for the Bullish Harami
The Bullish Harami pattern is most effective after a pronounced downtrend or at key support zones where investor sentiment is already pessimistic. It can also appear after news-driven selloffs or during periods of market overreaction. In these cases, the Harami can offer an early signal for value-oriented investors and short-term traders searching for attractive entry points ahead of a potential reversal.
Key Takeaways
- Bullish Harami signals a possible shift from bearish to bullish momentum.
- An inside day within the pattern shows diminishing selling pressure and rising indecision.
- Confirmation through a break above the inside candle’s high helps validate the reversal signal.
- The pattern is especially powerful when it forms near support or after extended declines.
- Using a stop-loss below the inside candle is a prudent risk management practice for traders.
In summary, the Bullish Harami is a classic reversal pattern that can help traders identify the early stages of a trend change. When confirmed by other technical signals and paired with sound risk management, it can become a valuable component of any trading strategy focused on capturing bullish reversals.