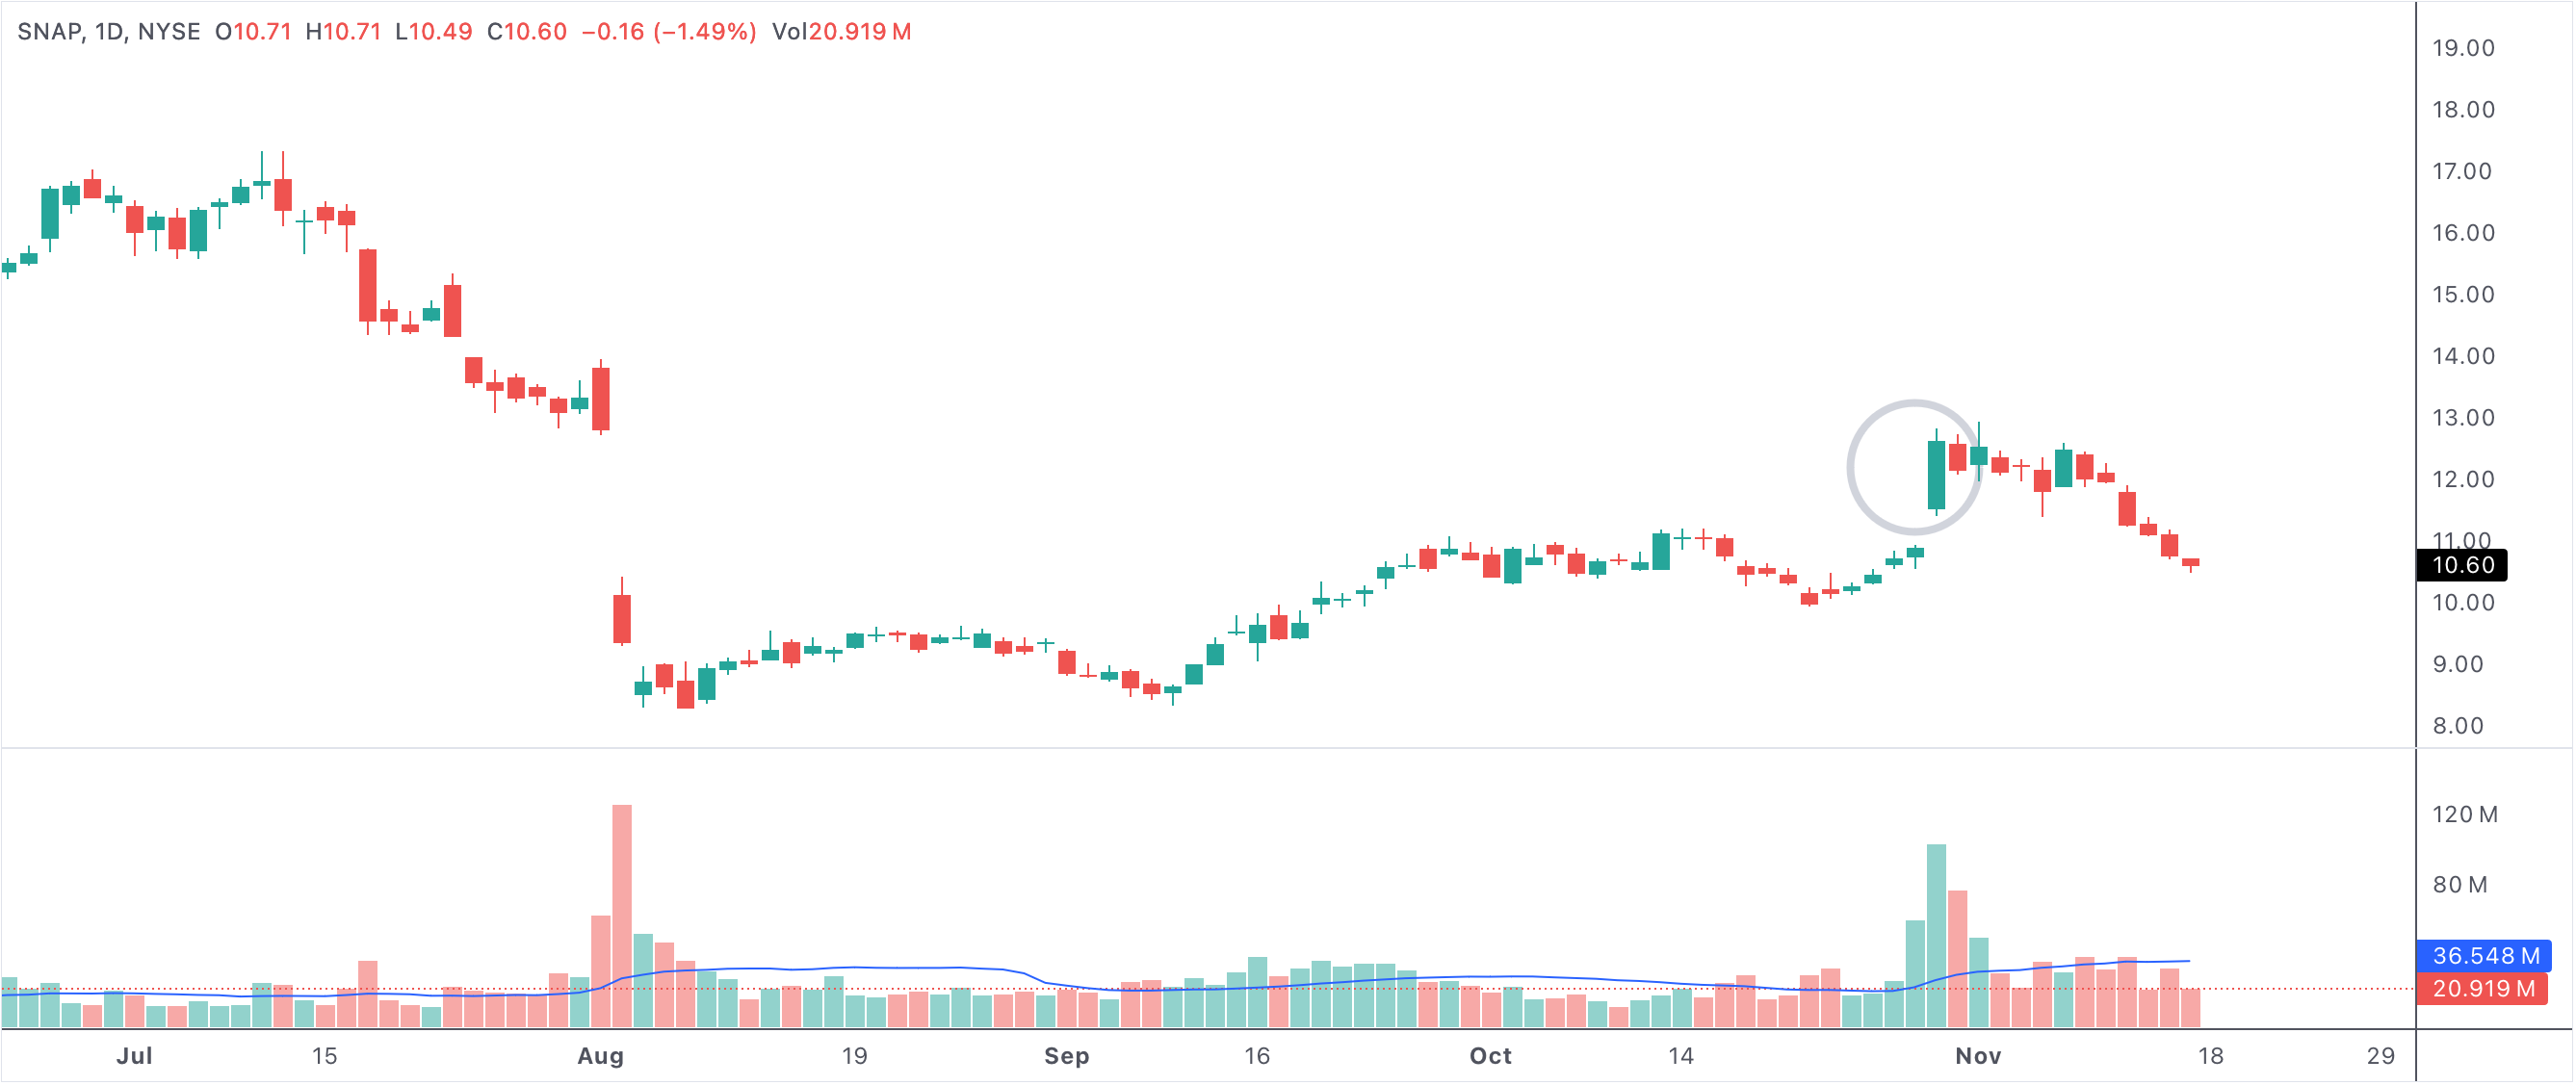
A bullish candle then a bearish inside day - indecision or reversal signal
The Bearish Harami pattern, or "Greenredinside," features a bullish candle followed by a bearish candle that forms an inside day. This classic setup in candlestick analysis is a key moment for technical traders, as it represents a period of market indecision after an initial show of strength. While the first candle reflects strong buying interest, the second—smaller, contained within the prior range—indicates caution and a pause in momentum. The duality of this pattern means it can foreshadow either trend continuation or a potential reversal, depending on subsequent price action.
greenredinside
An example of a bullish candle followed by a bearish inside day (Bearish Harami)
A bullish candle followed by a bearish candle that is an inside day
What Does This Pattern Mean?
In the language of candlestick patterns, an inside day is a session where the high and low prices stay within the range of the previous day. When this follows a strong green (bullish) candle, it signals that the market has paused after aggressive buying. The appearance of a red (bearish) inside candle suggests sellers are stepping in, but not forcefully enough to break the prior day’s trading range. This tug-of-war results in a pattern traders associate with potential change or continuation in the prevailing trend.
Bullish or Bearish: Context Is Key
While often referred to as a "Bearish Harami" in candlestick theory, this two-candle pattern does not guarantee a bearish reversal on its own. Instead, it highlights market indecision. In an ongoing uptrend, the inside day can act as a healthy consolidation—a pause for breath before the next leg higher. Bulls may see this as a sign that selling pressure is being absorbed and that the uptrend remains intact, particularly if the next candle breaks above the high of the pattern.
Conversely, if the market breaks down below the inside day’s low in subsequent sessions, it can confirm a reversal, suggesting buyers have lost control and sellers are taking over. Thus, confirmation through additional price movement is critical for interpreting the signal correctly.
How Traders Use the Pattern
Active traders watch for this pattern because it sets up a clear zone of support and resistance—the high and low of the two-candle setup. A break above resistance often triggers bullish entries, while a break below support signals a bearish move. Some traders use stop-loss orders just outside the pattern’s range to manage risk, knowing that a decisive move in either direction can result in a strong follow-through.
The Bearish Harami is also watched for potential false signals. Sometimes, the market can remain in consolidation for several sessions after the pattern, leading to "fakeouts." To increase confidence, many traders look for confirmation from other technical indicators, such as volume, moving averages, or broader market trends.
When Is This Pattern Most Reliable?
The pattern gains significance at the top of a rally, where bullish enthusiasm may be waning, or after an extended uptrend. Here, the shift to an inside day—especially with a bearish close—reflects the first real pushback from sellers. However, context remains essential: In a strong bull market, inside days can simply precede a breakout higher. In choppy or uncertain markets, the Bearish Harami pattern may carry more weight as a warning of trend exhaustion.
- Bearish Harami/Greenredinside: A bullish candle followed by a bearish inside day signals indecision.
- The pattern forms after upward momentum slows, marking a tug-of-war between buyers and sellers.
- Trend continuation is signaled by a break above the pattern; reversal by a move below.
- Watch for confirmation with volume, subsequent price action, or additional indicators.
- Risk management is key: set stops outside the pattern’s high/low range to avoid false signals.
In summary, a bullish candle followed by a bearish candle that is an inside day is a technical pattern that demands attention. It encapsulates a moment of indecision in the market—one that could lead to either a fresh move higher or the start of a reversal. By combining pattern recognition with confirmation from price and volume, traders can use the Bearish Harami as a strategic signal for their next move.