Bullish hollow candle on a gap down signals buyers stepping in and trend reversal
A bullish hollow candle forming after a gap down is a powerful visual signal on stock charts. This candlestick pattern suggests that, despite a bearish open and early selling pressure, buyers stepped in decisively during the session. The result is a hollow (unfilled) candle, which means the close price is above the open price—often an early sign of a trend reversal and a key indicator of buyer resilience.
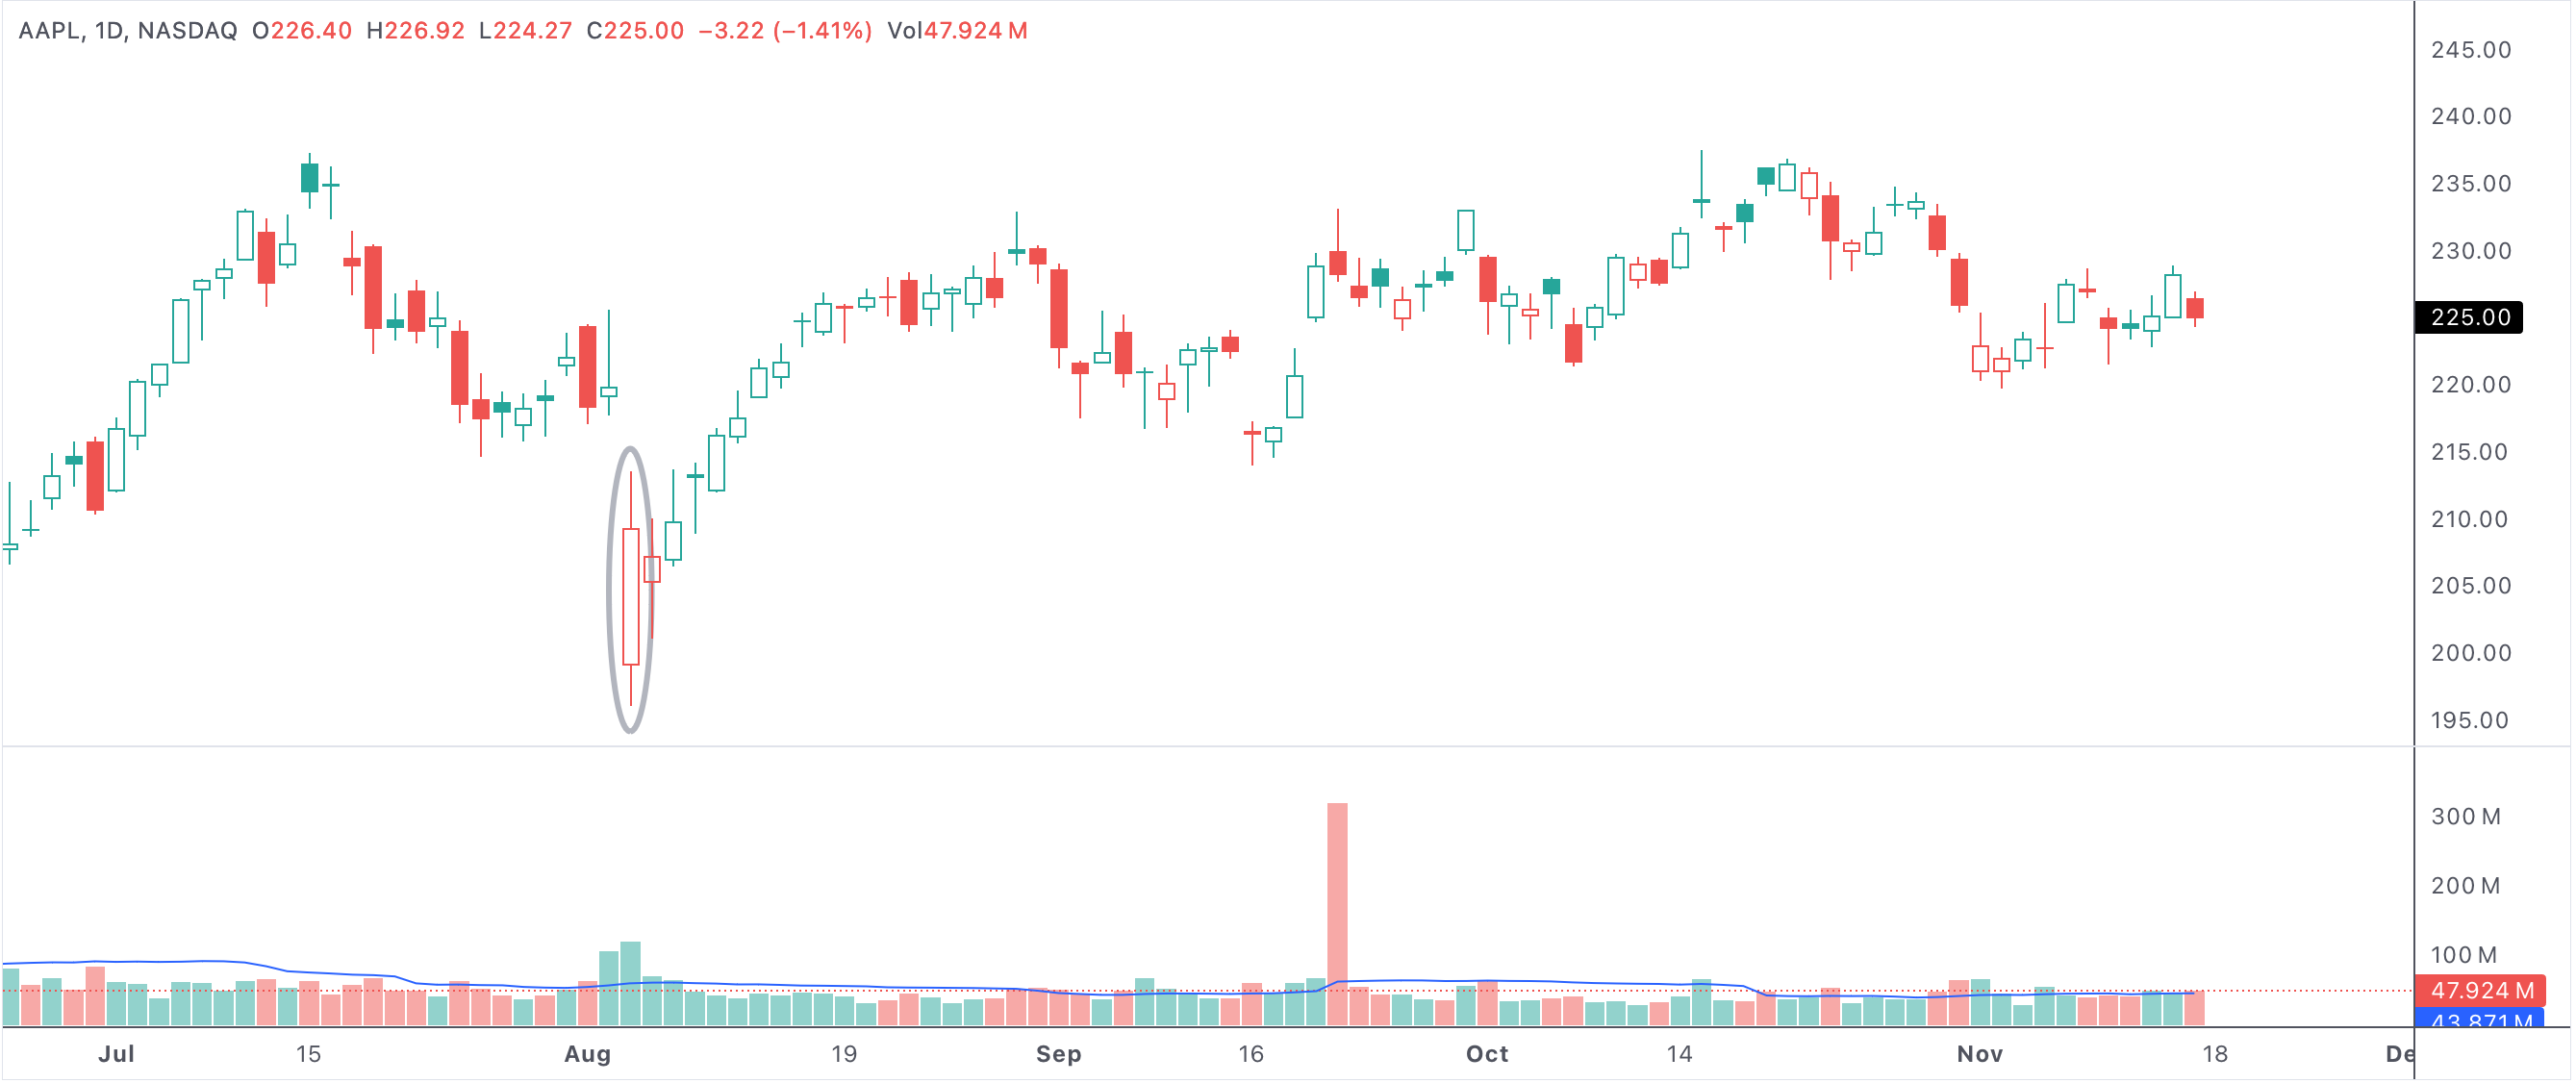
hollowredcandle
An example of a stock with a hollow red candle, a sign of buyers stepping in after a gap down
Bullish candle with a hollow body indicating buyers stepped in on a gap down
How to Read Hollow Candles After a Gap Down
On most stock charting platforms, a hollow candle appears when the closing price is higher than the opening price. When this forms right after a gap down—where the stock opens below the previous day’s close—it tells a story of intraday market psychology. Sellers dominated at the open, but buyers aggressively pushed the price higher through the session, overcoming negative sentiment and forming a bullish candle.
Why This Pattern Signals Potential Reversal
The appearance of a hollow candle following a gap down is especially meaningful when it comes after a series of red (filled) candles or a sharp decline. It often suggests support levels are being tested and defended. Traders interpret this as the first real evidence of buyers regaining control. This shift can mark the beginning of a reversal or at least a short-term bounce, particularly if volume increases on the day the pattern appears.
- Gap down, hollow body: Indicates initial panic, but buyers were strong enough to erase losses.
- Test of support: Pattern is most reliable when it forms at a key support area or after a downtrend.
- Buyer conviction: Closing above the open, after gapping lower, means buyers overpowered sellers.
Market Sentiment and Hollow Candles
Market sentiment shifts rapidly around support zones. When a hollow candle appears after a gap down, it reflects a sudden change in sentiment. This can cause short sellers to cover their positions and attract technical traders looking for reversal signals. The session’s low becomes an important reference for future trading, while the hollow body inspires confidence among bulls.
In some cases, this pattern is accompanied by increased trading volume, further confirming the significance of the reversal signal. Strong volume combined with a bullish hollow candle indicates that institutional buyers may be involved.
Using the Pattern in Your Trading Strategy
Many traders use the bullish hollow candle after a gap down as an entry signal, especially if other indicators align. They may look for confirmation in the following session—such as another higher close or a break above the hollow candle’s high—to reduce the risk of a false signal. Additionally, this pattern is more reliable when found after a clear downtrend or at long-term support levels.
Some strategies involve combining this candlestick signal with moving averages, RSI, or MACD to improve accuracy. If these indicators are showing oversold conditions or bullish divergence, the probability of a successful reversal increases.
Examples and Practical Insights
Consider a stock that has fallen for several days and gaps lower at the open, only for buyers to step in strongly, resulting in a hollow candle. This often signals that the selling is becoming exhausted and the price is too attractive for buyers to ignore. If other stocks in the sector or broader market are also bouncing, the pattern becomes even more compelling.
This signal is not only limited to daily charts; it also works on intraday and weekly timeframes, allowing traders to adapt the strategy to their style and risk tolerance.
Conclusion: Why Hollow Candles on Gap Downs Matter
In summary, a bullish hollow candle on a gap down day is a visually clear and psychologically meaningful pattern. It suggests that buyers have overcome negative sentiment, signaling potential support and an impending trend reversal. While no single pattern is foolproof, this setup—especially when combined with volume and other technical indicators—offers a valuable early warning for traders seeking strong entries at market turning points.