Consecutive days with stochastic %K above 90 - overbought signals & risk
When a stock or index registers consecutive days with stochastic %K above 90, it immediately attracts attention from technical traders and investors. The stochastic oscillator, a popular momentum indicator, measures the position of a security’s closing price relative to its price range over a set period. When the %K value rises above 90, it typically signals strong upside momentum and a sustained bullish trend—but it can also serve as a warning that the asset is entering overbought territory.
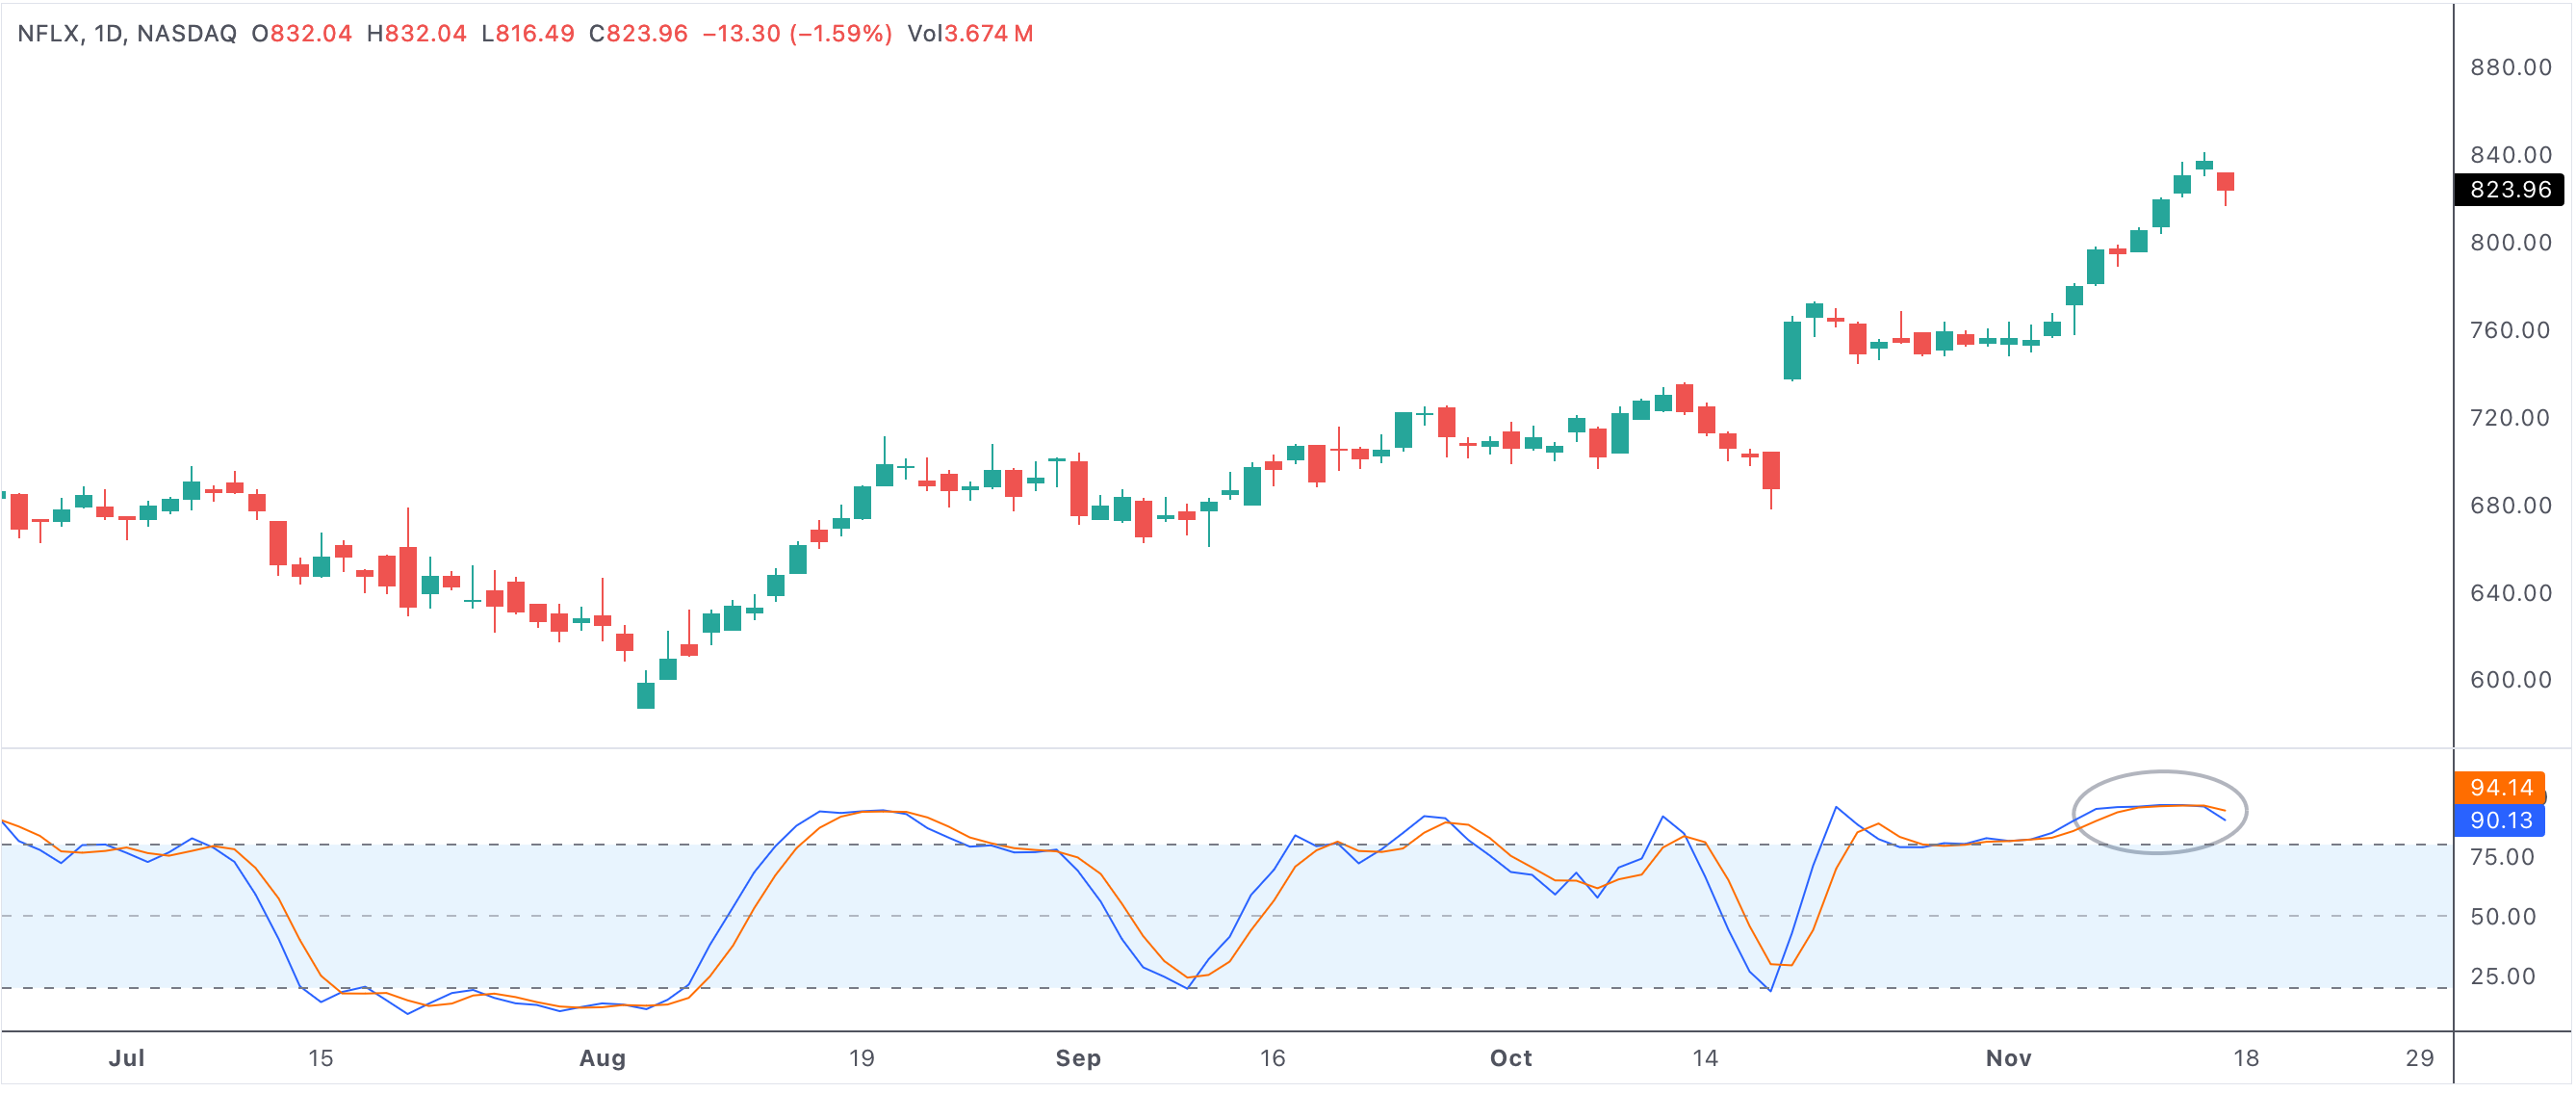
stochkoverbought
An example of a stock with stochastic %K above 90 for several consecutive days
Consecutive days with stoch k above 90
Understanding the Stochastic Oscillator
The stochastic oscillator consists of two lines: %K, the faster-moving line, and %D, a moving average of %K. Readings above 80 typically indicate overbought conditions, but when %K remains above 90 for multiple days, it signals extraordinary bullish strength. This can occur during powerful uptrends, after positive earnings, or in strong market rallies.
While a high stochastic reading means buyers have dominated the price action, it does not guarantee that the asset will continue to rise. In fact, extended periods of %K above 90 often precede reversals, as markets rarely remain overbought indefinitely.
Bullish Momentum vs. Overbought Risks
Several consecutive days with %K above 90 often mark a time of intense optimism and aggressive buying. Traders may interpret this as confirmation that a trend is accelerating, prompting further buying interest. However, these readings also indicate that the price is near the upper end of its recent range and may be vulnerable to a correction if momentum fades.
The key risk with persistent overbought conditions is that they eventually attract profit-taking. Once investors sense that the rally is losing steam or that gains are stretched relative to fundamentals, selling pressure can emerge quickly. This is especially true if broader market sentiment shifts or external events trigger uncertainty.
Signals for Potential Reversals
Technical analysts use consecutive days of stochastic %K above 90 as a potential warning to prepare for a reversal or at least a short-term pullback. While some rallies can last longer than expected, overbought signals often precede consolidation or a downturn. Watch for:
- A sudden drop in %K below 90 after a long streak
- Bearish crossovers, where %K falls below %D
- Failure to set new price highs while stochastic remains elevated (bearish divergence)
- Heavy volume on down days, which may confirm profit-taking
Each of these technical cues can help confirm that a trend is losing strength and a reversal or correction is likely.
Strategic Approaches for Traders and Investors
Traders who spot consecutive days with stochastic %K above 90 often use a mix of strategies. Some may continue riding the bullish trend with tight stop-losses, while others take partial profits or tighten their risk controls. Long-term investors might avoid new buys until a clearer signal of a pullback or consolidation appears.
Confirmation from other technical indicators, such as moving averages, RSI, or price action around support and resistance, can help filter out false alarms. Combining multiple tools helps distinguish between a strong continuation and an imminent reversal.
Common Pitfalls and the Importance of Context
Not every overbought reading leads to an immediate selloff. In strong bull markets or during news-driven rallies, %K can stay above 90 for several days, weeks, or even longer. The context—such as overall market conditions, volume trends, and sector leadership—matters as much as the indicator itself.
- Extended %K above 90 is a warning, not a sell signal by itself.
- Look for confirmation from other indicators before acting on overbought signals.
- Sudden drops in %K or bearish crossovers often confirm a pending reversal.
- Consider the broader market environment before making trading decisions.
- Maintain disciplined risk management at all times.
Summary: Balancing Momentum and Reversal Risk
In summary, consecutive days with stochastic %K above 90 reflect powerful bullish momentum but also warn that an asset may be overextended. While this setup can precede sharp pullbacks or corrections, it can also signal strong underlying demand in trending markets. Careful analysis, risk management, and confirmation from additional indicators help traders and investors capitalize on opportunities while avoiding the pitfalls of chasing overbought rallies.