Consecutive days with stochastic %K above %D - momentum and market insights
When the stochastic oscillator’s %K line remains above the %D line for consecutive days, technical analysts often pay close attention. This crossover and continued separation frequently signal an ongoing shift in momentum, offering valuable insights into potential bullish or bearish developments depending on the broader context of the stock or market.
stochkaboved
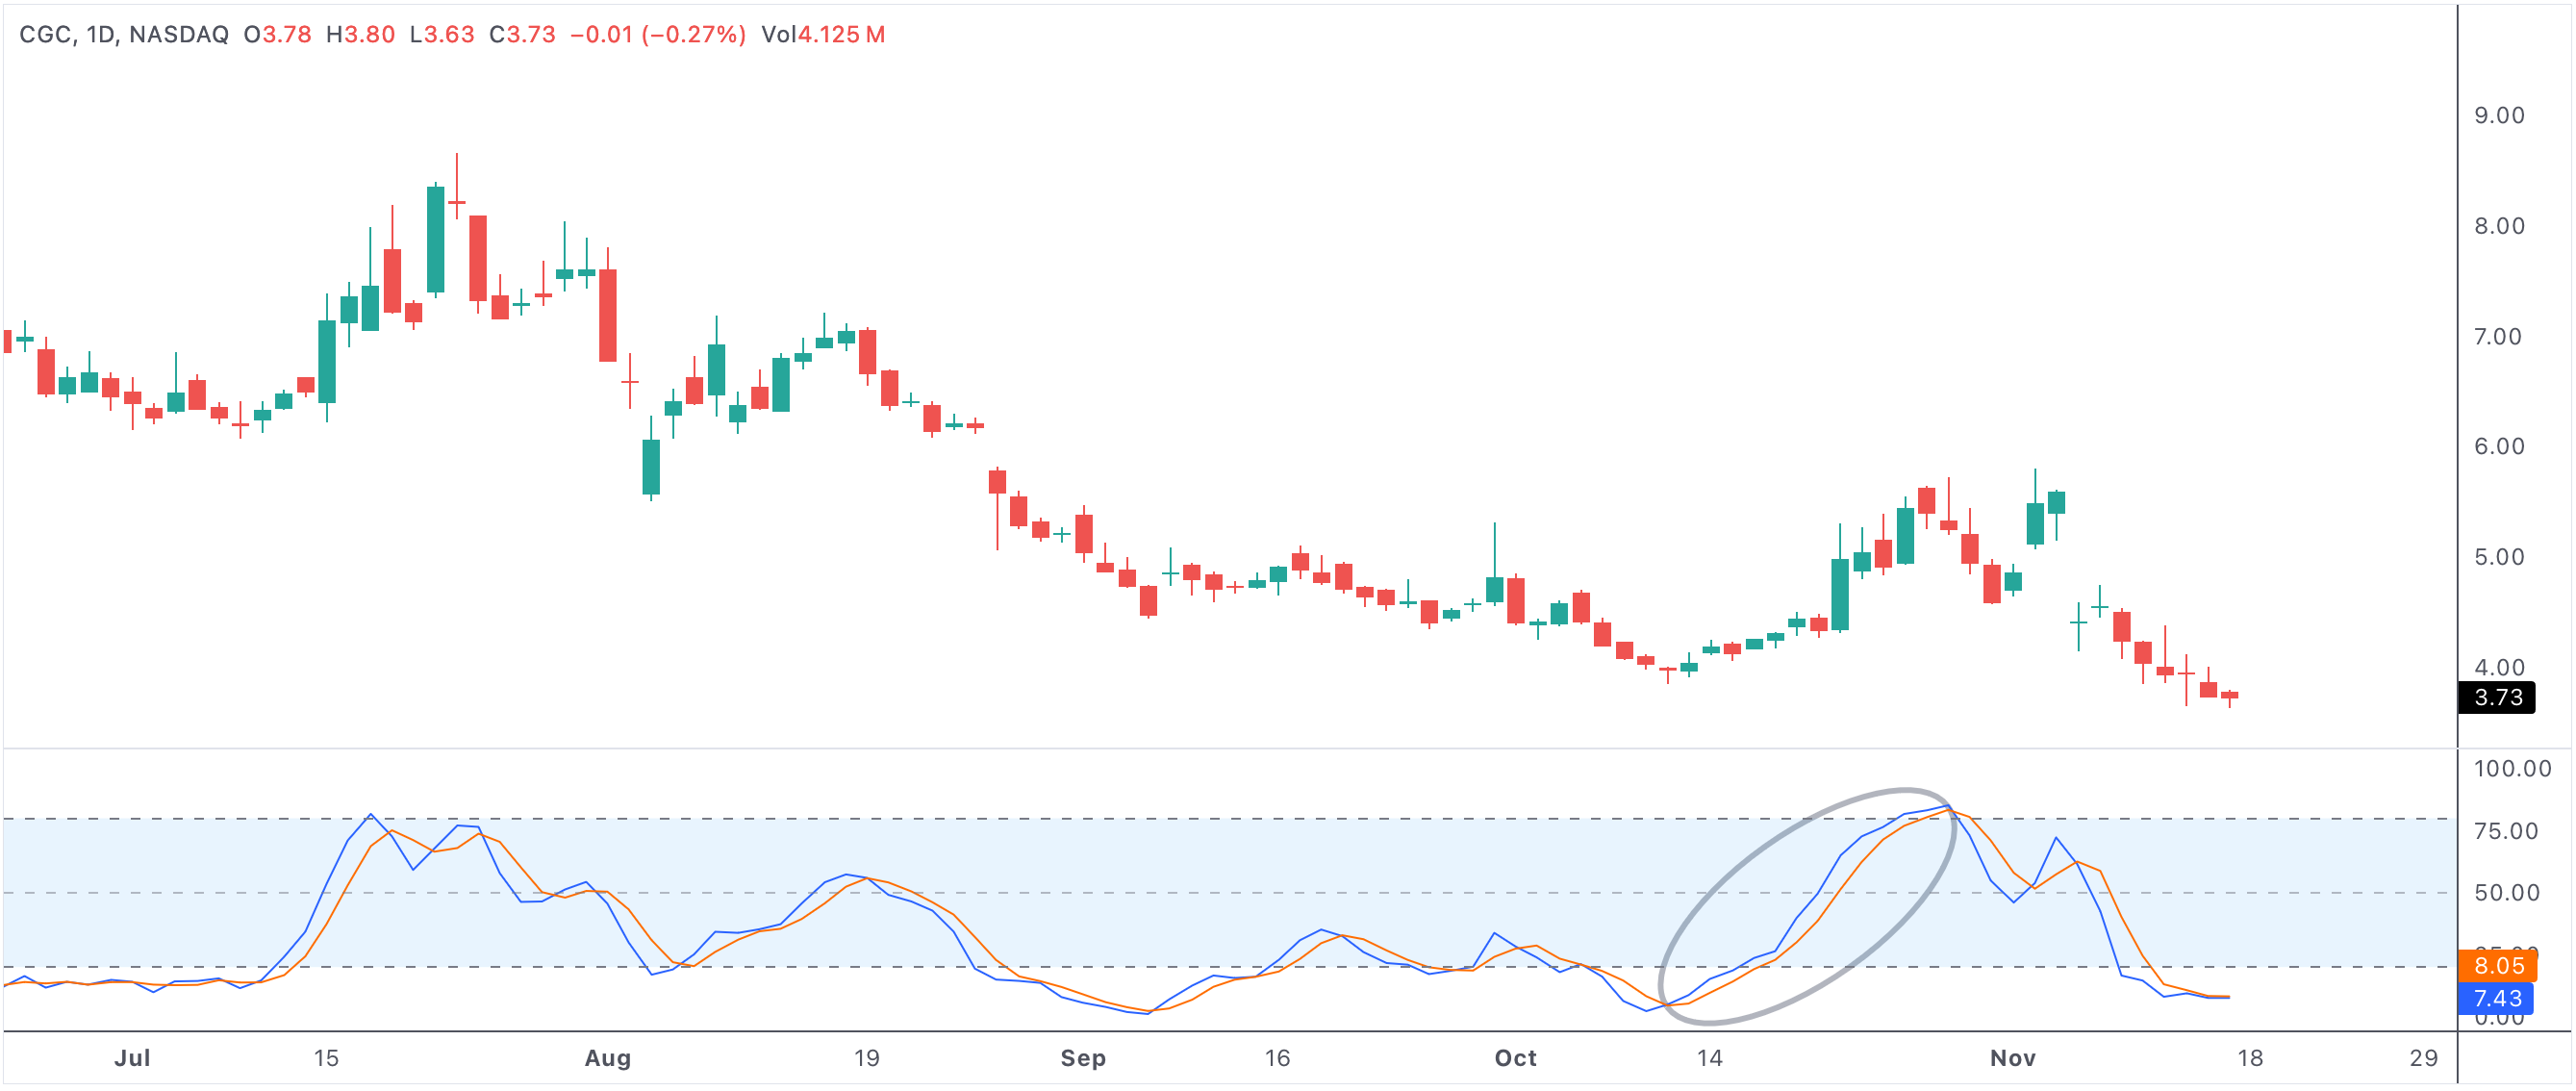
An example of a stock with a stochastic K above stochastic D for several days
Consecutive days with stoch k above stoch d
What Does It Mean When %K Stays Above %D?
The stochastic oscillator is a popular momentum indicator, comparing a stock's closing price to its price range over a certain period—commonly 14 days. The %K line represents the current close’s position within that range, while %D is typically a moving average of %K. When %K crosses above and holds above %D for several sessions, it typically means upward price momentum is building and buyers are in control.
Traders view this as a possible sign of emerging bullish strength, especially if the broader market is trending higher. Such momentum often leads to further gains as more participants notice the pattern and join the move, creating a self-reinforcing effect. However, not all crossovers are created equal—context matters.
Momentum Signals in Bullish and Bearish Markets
In an uptrending market, consecutive days with %K above %D reinforce the bullish case. This pattern may suggest a continuation of the uptrend, providing an entry opportunity for trend followers or momentum traders. Stocks showing this pattern may outperform their peers in the short term, particularly if confirmed by rising volume or supportive price action.
On the other hand, in an overbought or extended market, several days of %K above %D could act as a warning signal. When the stochastic oscillator remains in the overbought zone (typically above 80) for too long, it may indicate the stock is due for a pause or pullback. If %K begins to turn down or crosses below %D after an extended run, it can signal an impending reversal, prompting profit-taking or tighter stops.
How Traders Use This Pattern
Traders commonly use the %K above %D streak as a component of a broader trading strategy. Some enter long positions on the initial crossover, while others wait for a confirmation—such as a second or third consecutive day of %K dominance or a supportive breakout on the price chart. The length of time %K remains above %D can add confidence; the longer the streak, the more conviction in the underlying move.
It’s important to watch for divergence between the stochastic oscillator and price. If the price is making new highs but the stochastic isn’t, this “bearish divergence” could warn of weakening momentum. Conversely, if price makes new lows but the oscillator fails to confirm, a bullish reversal may be near.
Risks and Limitations of the Stochastic Oscillator
Like all indicators, the stochastic oscillator is not foolproof. In strong trends, it can remain overbought or oversold for extended periods, resulting in false signals. Relying solely on %K above %D without considering price action, volume, or the broader market environment may lead to premature entries or exits.
The stochastic indicator works best when used alongside other technical tools such as support and resistance levels, trendlines, moving averages, or candlestick patterns. Combining multiple indicators helps traders filter out noise and avoid acting on misleading momentum shifts.
- Consecutive days with %K above %D signal sustained bullish momentum but may also occur in overbought conditions.
- Always analyze context—trend, volume, and price action enhance reliability.
- Watch for divergence as a warning sign of a potential reversal.
- This pattern is useful for short-term trades, but longer-term investors should look for confirmation from other indicators.
- Managing risk is crucial; set stop losses and monitor for quick momentum changes.
Summary: Applying the Pattern in Real Markets
In summary, a streak of consecutive days with stochastic %K above %D can be a powerful clue about short-term momentum. While it often points to bullish opportunities, traders must consider the overall market context and be wary of overbought extremes. By integrating stochastic signals with price action, volume, and additional technical indicators, investors can make more informed decisions and better manage risk in any market environment.