Consecutive Days With Stochastic %K Below 10 - Oversold Stock Signals
Stocks showing consecutive days with stochastic %K below 10 attract the attention of traders and technical analysts for their potential to signal deeply oversold conditions. The stochastic oscillator is a popular momentum indicator, and when its %K value remains under 10 for multiple days, it highlights extreme weakness and persistent selling pressure in a stock or across the broader market. While this initially points to a bearish environment, history shows such conditions often lay the groundwork for significant bullish reversals.
stochkoversold
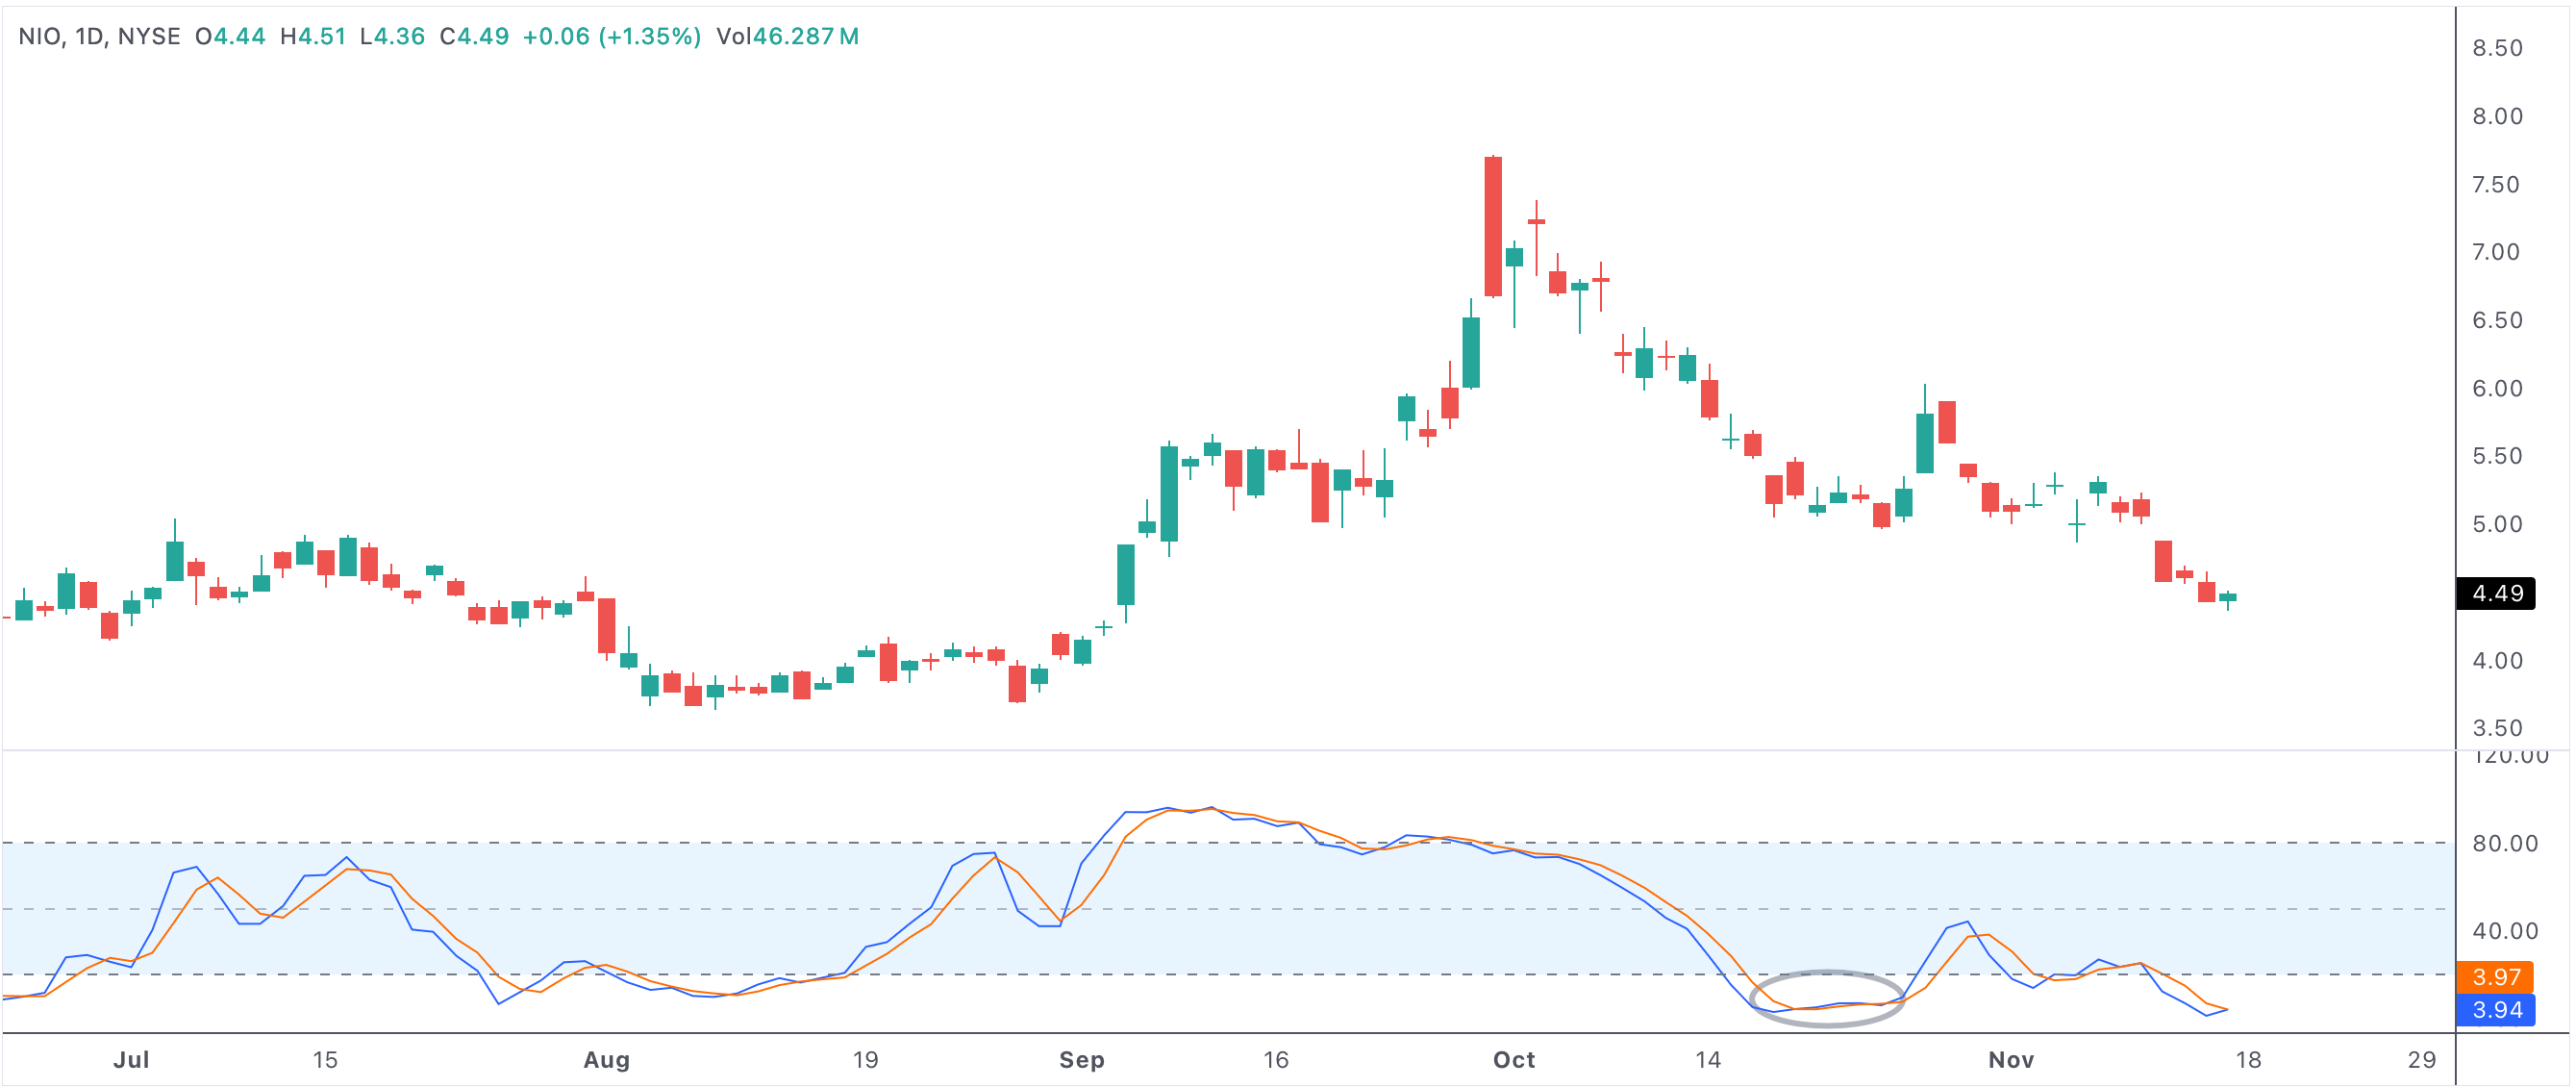
An example of a stock with a stochastic K below 10 for several consecutive days
Consecutive days with stoch k below 10
What Does Stochastic %K Below 10 Mean?
The stochastic oscillator compares a stock's closing price to its price range over a given period, usually 14 days. The %K line measures the current closing price's position relative to the high and low over that period, presented as a percentage. When %K falls below 10, it signals the price is near the lowest levels seen in that timeframe—an indicator of heavy selling and an oversold condition.
Consecutive days with %K below 10 emphasize that selling is not just a quick dip, but a sustained trend. Many traders view this as a sign the stock or index may be due for a reversal, as continued selling can’t last forever without fundamental justification.
Why Oversold Signals Matter for Bullish Reversals
Oversold readings are crucial for traders looking to time market reversals or enter positions ahead of a recovery. Extended periods below %K 10 suggest that panic or negative sentiment has peaked. When price action stabilizes or begins to show positive divergence (such as price holding steady while %K starts to rise), it can indicate selling exhaustion.
Professional traders and institutions often monitor these setups closely. They may start accumulating shares quietly while most market participants are still focused on recent losses. This shift in momentum is sometimes the earliest clue that a bullish reversal is on the horizon.
Institutional Buying and Accumulation Patterns
Institutional investors rarely buy at the very bottom, but they are often early in sensing opportunity. As stocks languish in oversold territory, large players may gradually accumulate positions, knowing that even modest positive news or improved sentiment can spark a powerful rally. Extended periods with stochastic %K below 10 can create ideal entry points for those with a longer-term perspective.
Combining Stochastic Signals with Market Context
No technical indicator should be used in isolation. When interpreting consecutive days with %K below 10, savvy traders also examine volume, support zones, and broader economic indicators. For example, an oversold stochastic reading that occurs as the stock approaches major long-term support levels, or is paired with rising volume and insider buying, provides a much stronger bullish setup.
Similarly, traders look for “bullish divergence”—where the stochastic oscillator starts to move higher even as price makes a new low. This divergence often marks a turning point and an early entry for aggressive buyers.
- Multiple days with stochastic %K below 10 often precede powerful rebounds.
- These setups offer early signals for traders seeking market reversals and bargains.
- Institutional accumulation is common during prolonged oversold periods.
- Combining stochastic signals with volume and support levels improves accuracy.
- Bullish divergence between price and %K can strengthen the reversal signal.
Trading Strategy and Risk Management
While oversold stochastic signals are compelling, traders should use risk management and confirmation before entering trades. Waiting for %K to cross back above 10, or for bullish candlestick patterns and volume surges, can improve win rates. Stops should be placed below recent lows to guard against further downside, especially if broader market conditions remain weak.
In summary, stocks with consecutive days of stochastic %K below 10 represent deep oversold opportunities that often precede bullish reversals. By understanding the psychology, institutional behavior, and technical context behind these setups, traders can position themselves ahead of meaningful market recoveries.