Consecutive days with stochastic %K below %D - bullish reversal setup
Consecutive days with the stochastic %K line below the %D line are a classic sign of persistent weakness, often creating fertile ground for a bullish reversal. In technical analysis, the stochastic oscillator is widely used to measure momentum and identify overbought or oversold conditions. When the %K line—representing the current close relative to the recent range—remains below the slower-moving %D line for several days, it signals that the prevailing selling pressure could be nearing exhaustion.
stochkbelowd
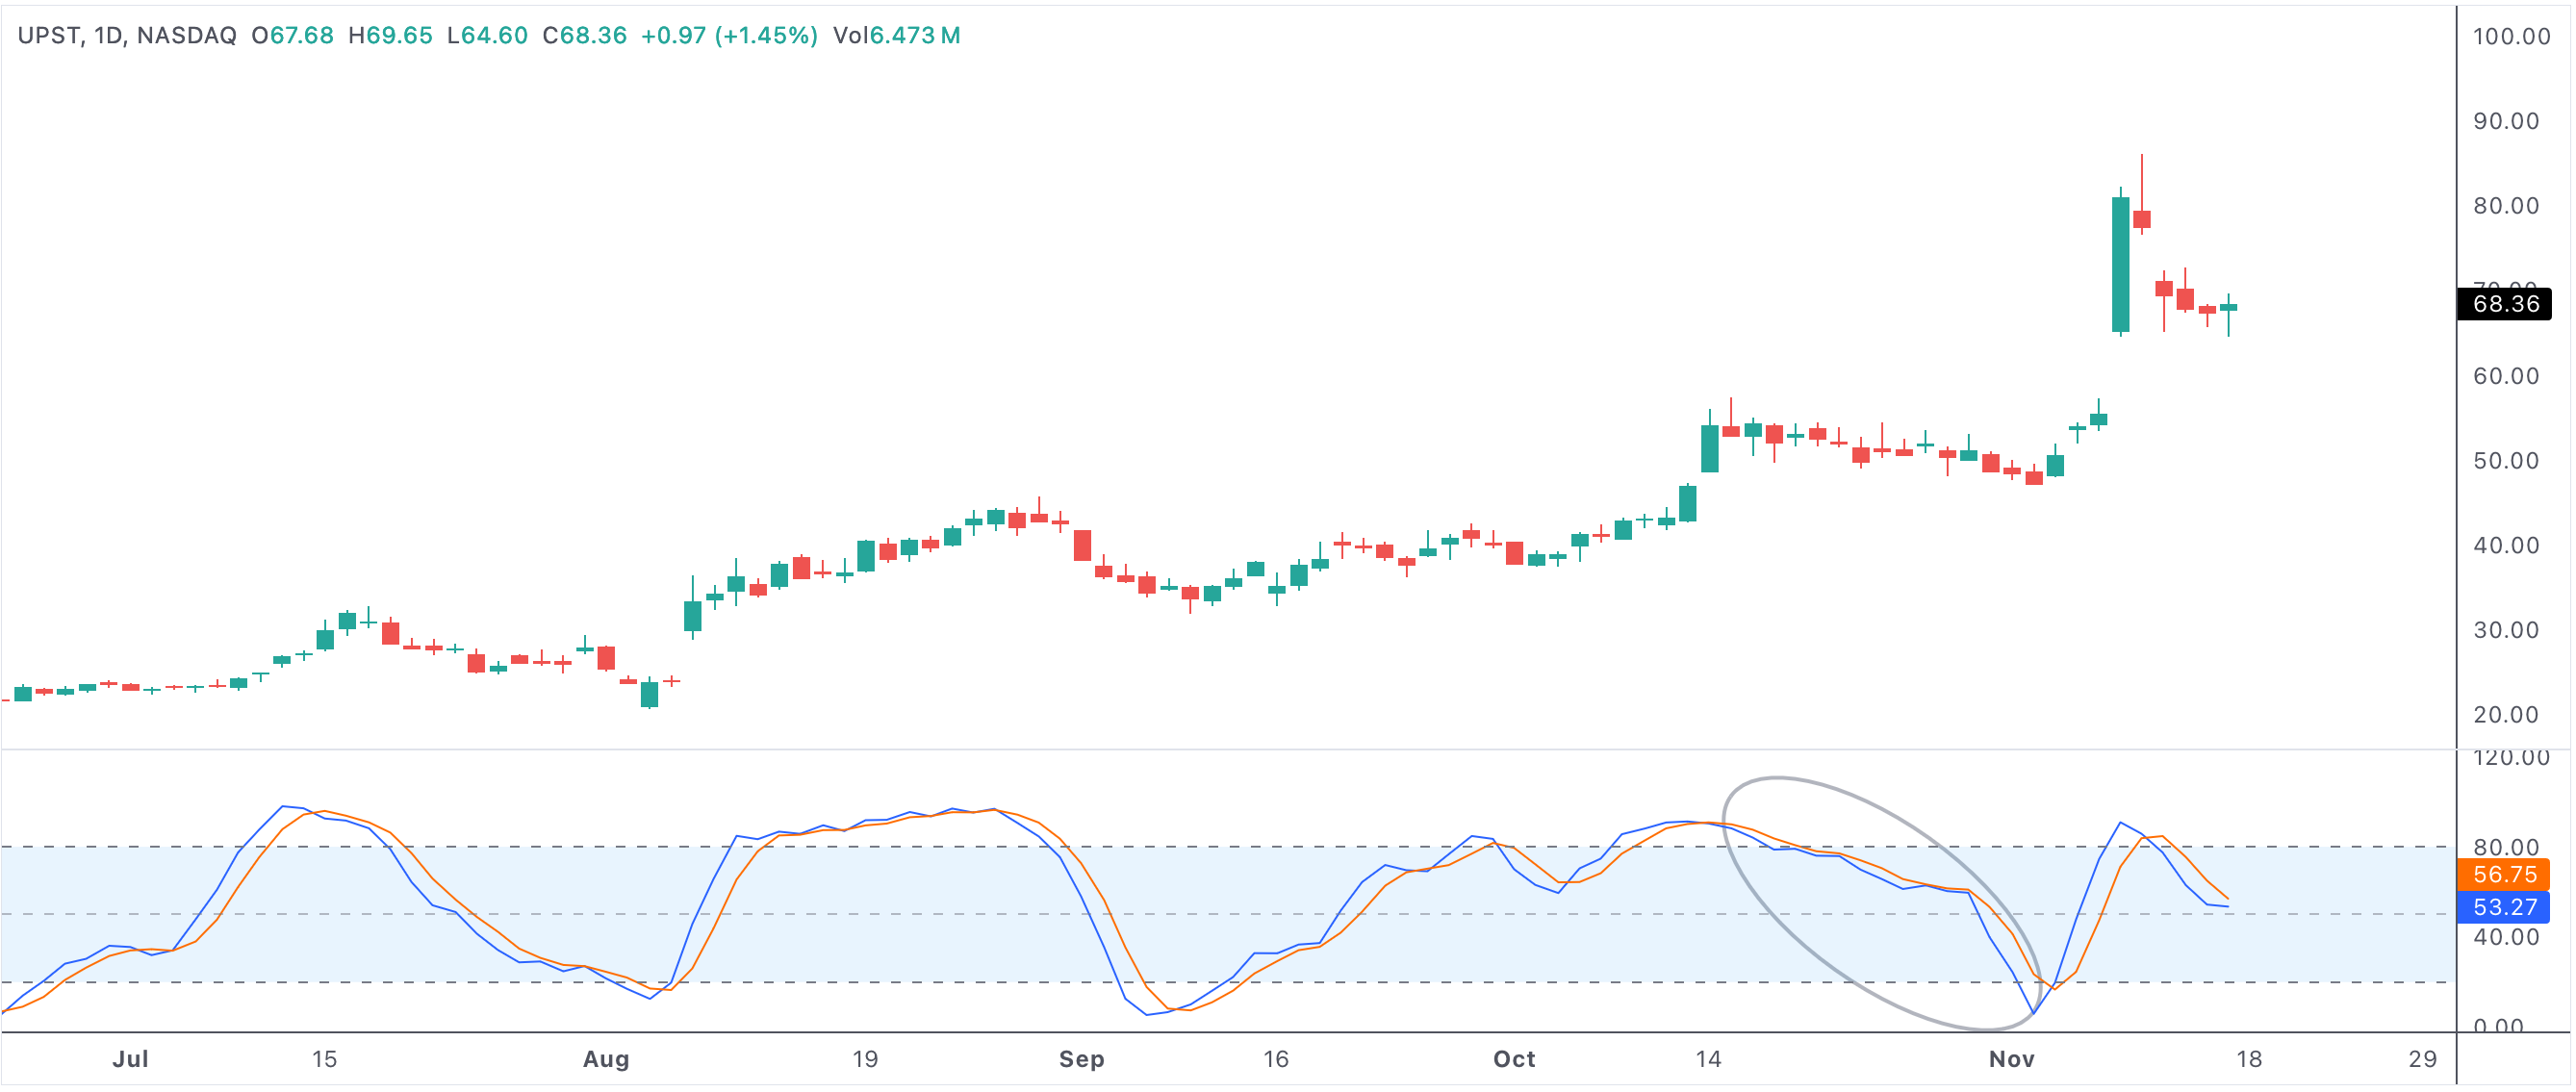
An example of a stock with a stochastic %K below stochastic %D for multiple sessions.
Consecutive days with stoch k below stoch d
Understanding the Stochastic Oscillator
The stochastic oscillator compares a security's closing price to its price range over a defined period, typically 14 sessions. The %K line is the raw, faster-moving value, while the %D is a smoothed average. When %K crosses above %D, it's a bullish signal; when %K stays below %D for a stretch, it often signals sustained negative sentiment.
However, when this bearish structure persists for several consecutive days, the likelihood increases that a reversal could be imminent. This is especially true if other technical factors, such as support levels or bullish divergences, begin to emerge.
Why Consecutive Days Below Matter
A single dip of %K below %D may not offer a strong signal, but a series of days often suggests a prolonged oversold condition. Sellers may be exhausting their conviction, and buyers are quietly preparing to step in. This is why many swing traders and technical investors watch for consecutive sessions—sometimes three or more—of %K staying under %D as an early warning of a momentum shift.
- Persistent oversold: Several days of %K below %D can create undervalued entry opportunities.
- Reversal potential: This setup often precedes sharp bullish moves, especially if volume starts to rise or if positive divergences form with price.
- Confirmation: The best signals appear when %K moves back above %D, supported by price breaking key resistance or closing higher.
Combining With Other Indicators
No indicator should be used in isolation. When analyzing consecutive days of %K below %D, traders look for further confirmation—like RSI showing oversold readings, price approaching a well-defined support level, or bullish candlestick patterns (such as hammer or engulfing formations). If these elements align, confidence in a bullish reversal increases.
Also, institutional buyers and value investors tend to accumulate during these periods of weakness, laying the foundation for a significant move when momentum returns.
Psychology Behind the Setup
Extended periods of %K below %D can cause frustration and fear among retail holders, prompting capitulation and selling near bottoms. However, savvy traders recognize that markets tend to overreact both ways. Once the last wave of selling is absorbed, a technical bounce or reversal becomes more likely, as fresh buyers step in to take advantage of the perceived value.
When the reversal does come—often marked by %K crossing decisively above %D—it can trigger a surge of buying activity, as both short sellers cover and new longs rush in, propelling prices higher.
How to Trade the Signal
Many traders enter positions once %K crosses back above %D after several days below, especially if it happens near a historical support zone or with a surge in volume. Stops are typically placed just below the recent low to limit risk, and targets may be set at resistance or previous swing highs.
- Watch for confirmation from price action or other indicators before entering.
- Size positions appropriately, as false signals are possible if the broader trend remains bearish.
- Combine with overall market context to improve win rates and minimize drawdowns.
Conclusion: An Early Alert for Bullish Reversal
In summary, consecutive days with stochastic %K below %D offer a reliable early warning for possible bullish reversals—especially when combined with strong technical support and evidence of selling exhaustion. Traders who understand the underlying psychology and use sound risk management can take advantage of these oversold setups for timely and strategic entries in the stock market.