Consolidation pattern with second candle inside the first suggests breakout
In technical analysis, the Inside Day pattern—sometimes called a consolidation pattern—occurs when a stock's daily trading range (its high and low) falls entirely within the high and low of the previous trading day. This creates a situation where the second candle is "inside" the first candle, visually represented by a smaller bar nested within a larger bar on a candlestick chart. This classic setup is a well-known indicator of market indecision, consolidation, or a pause in the ongoing trend.
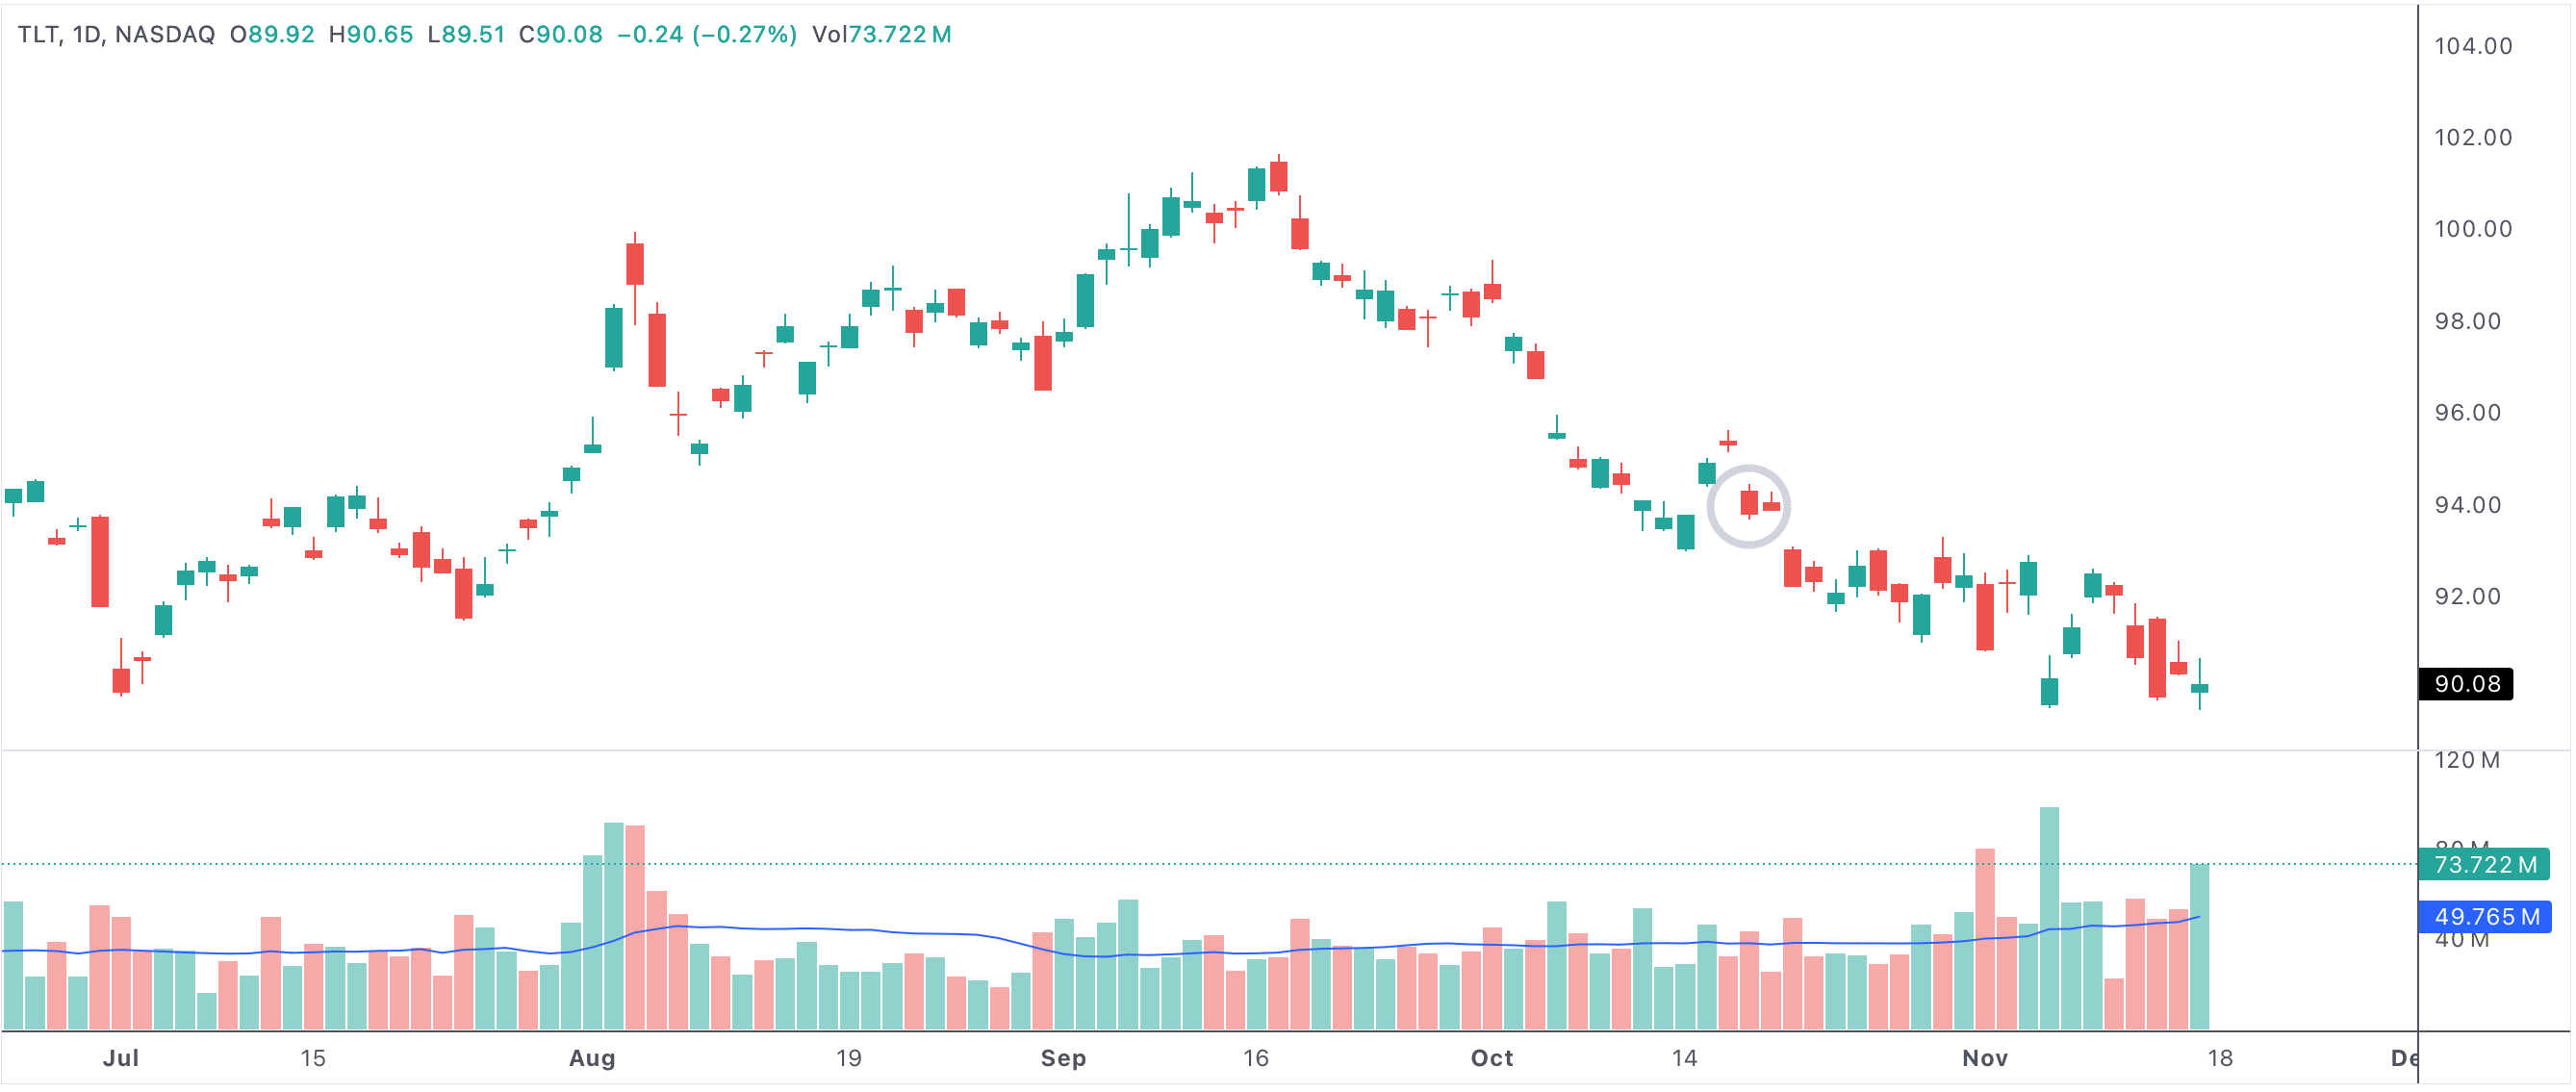
Inside Day Example
A visual representation of a stock showing the consolidation or Inside Day pattern.
Consolidation pattern with the second candle within the range of the first
Understanding the Inside Day Pattern
The Inside Day is most significant during periods of heightened volatility or after an extended move in either direction. It occurs when traders are unwilling to push prices past the previous day’s range, resulting in reduced volatility. This reflects a moment of equilibrium between buyers and sellers—neither side has enough conviction to drive a breakout or breakdown. As such, Inside Days can often be found during market consolidation phases and are carefully watched by technical analysts and active traders.
Why Consolidation Patterns Matter
The consolidation pattern, especially when the second candle is entirely within the first, is not just a sign of indecision but also a potential precursor to significant market movement. The low volatility and range contraction suggest the market is "coiling," storing potential energy for a larger move once a breakout occurs. Because of this, the Inside Day is often a signal to prepare for a price action breakout, which can present both risks and opportunities for traders.
Breakouts and Trend Reversals
A major reason Inside Days are so valuable is their ability to precede strong breakouts or even trend reversals. When price finally breaks above the high or below the low of the Inside Day, it often signals the start of a new trend or the continuation of the existing one. Traders look for confirmation with increased trading volume and momentum to validate these breakouts. The direction of the breakout—either up or down—often depends on broader market sentiment and technical context.
How Traders Use the Inside Day Pattern
Traders and investors use Inside Days to identify potential entry and exit points. For example, a breakout above the Inside Day's high may be used as a buy signal, especially if accompanied by a surge in volume or supporting technical indicators like RSI or MACD. Conversely, a breakdown below the Inside Day's low could be a signal for short selling or risk management. Many professional traders will wait for a clear breakout or breakdown before taking action, using stop-losses to manage risk.
Market Indecision and Volatility
The Inside Day is synonymous with market indecision. It often occurs when the market is digesting news, after strong moves, or ahead of important economic data releases. Because volatility is typically lower during Inside Days, they can serve as an opportunity for traders to prepare for increased volatility ahead. The contraction in price action during consolidation patterns like the Inside Day is a key reason why these setups can signal upcoming sharp moves.
Inside Days in Broader Technical Analysis
The Inside Day does not exist in a vacuum—it is best analyzed in the context of broader technical analysis. When combined with other indicators or patterns (such as support/resistance levels, moving averages, or trendlines), Inside Days can provide even greater predictive power. Additionally, Inside Days can be found in all timeframes, making them relevant for day traders, swing traders, and longer-term investors alike.
- Inside Day patterns are common in stocks, indices, and other assets, signaling possible breakout opportunities.
- This pattern shows consolidation, balance between buyers and sellers, and contraction of volatility.
- Breakouts after Inside Days can mark the start of a new trend or a reversal of the existing one.
- Technical traders monitor Inside Days to set up trades with tight risk controls and clear entry points.
- Combining Inside Day analysis with volume, market sentiment, and other indicators strengthens trading strategies.
Ultimately, the consolidation pattern with the second candle within the range of the first is a valuable tool for anyone seeking to capitalize on price breakouts and manage trading risk. By understanding how and why Inside Days form, traders can position themselves ahead of major price movements and use the pattern as a foundation for disciplined, technically-driven strategies.