First Day Above 10 SMA After Extended Weakness – Bullish Signal
When a stock finally closes above its 10-day simple moving average (SMA) after spending an extended stretch below, it can signal a meaningful momentum shift. This technical milestone suggests selling pressure is easing and buyers are starting to regain control, often marking the first sign of a short-term recovery.
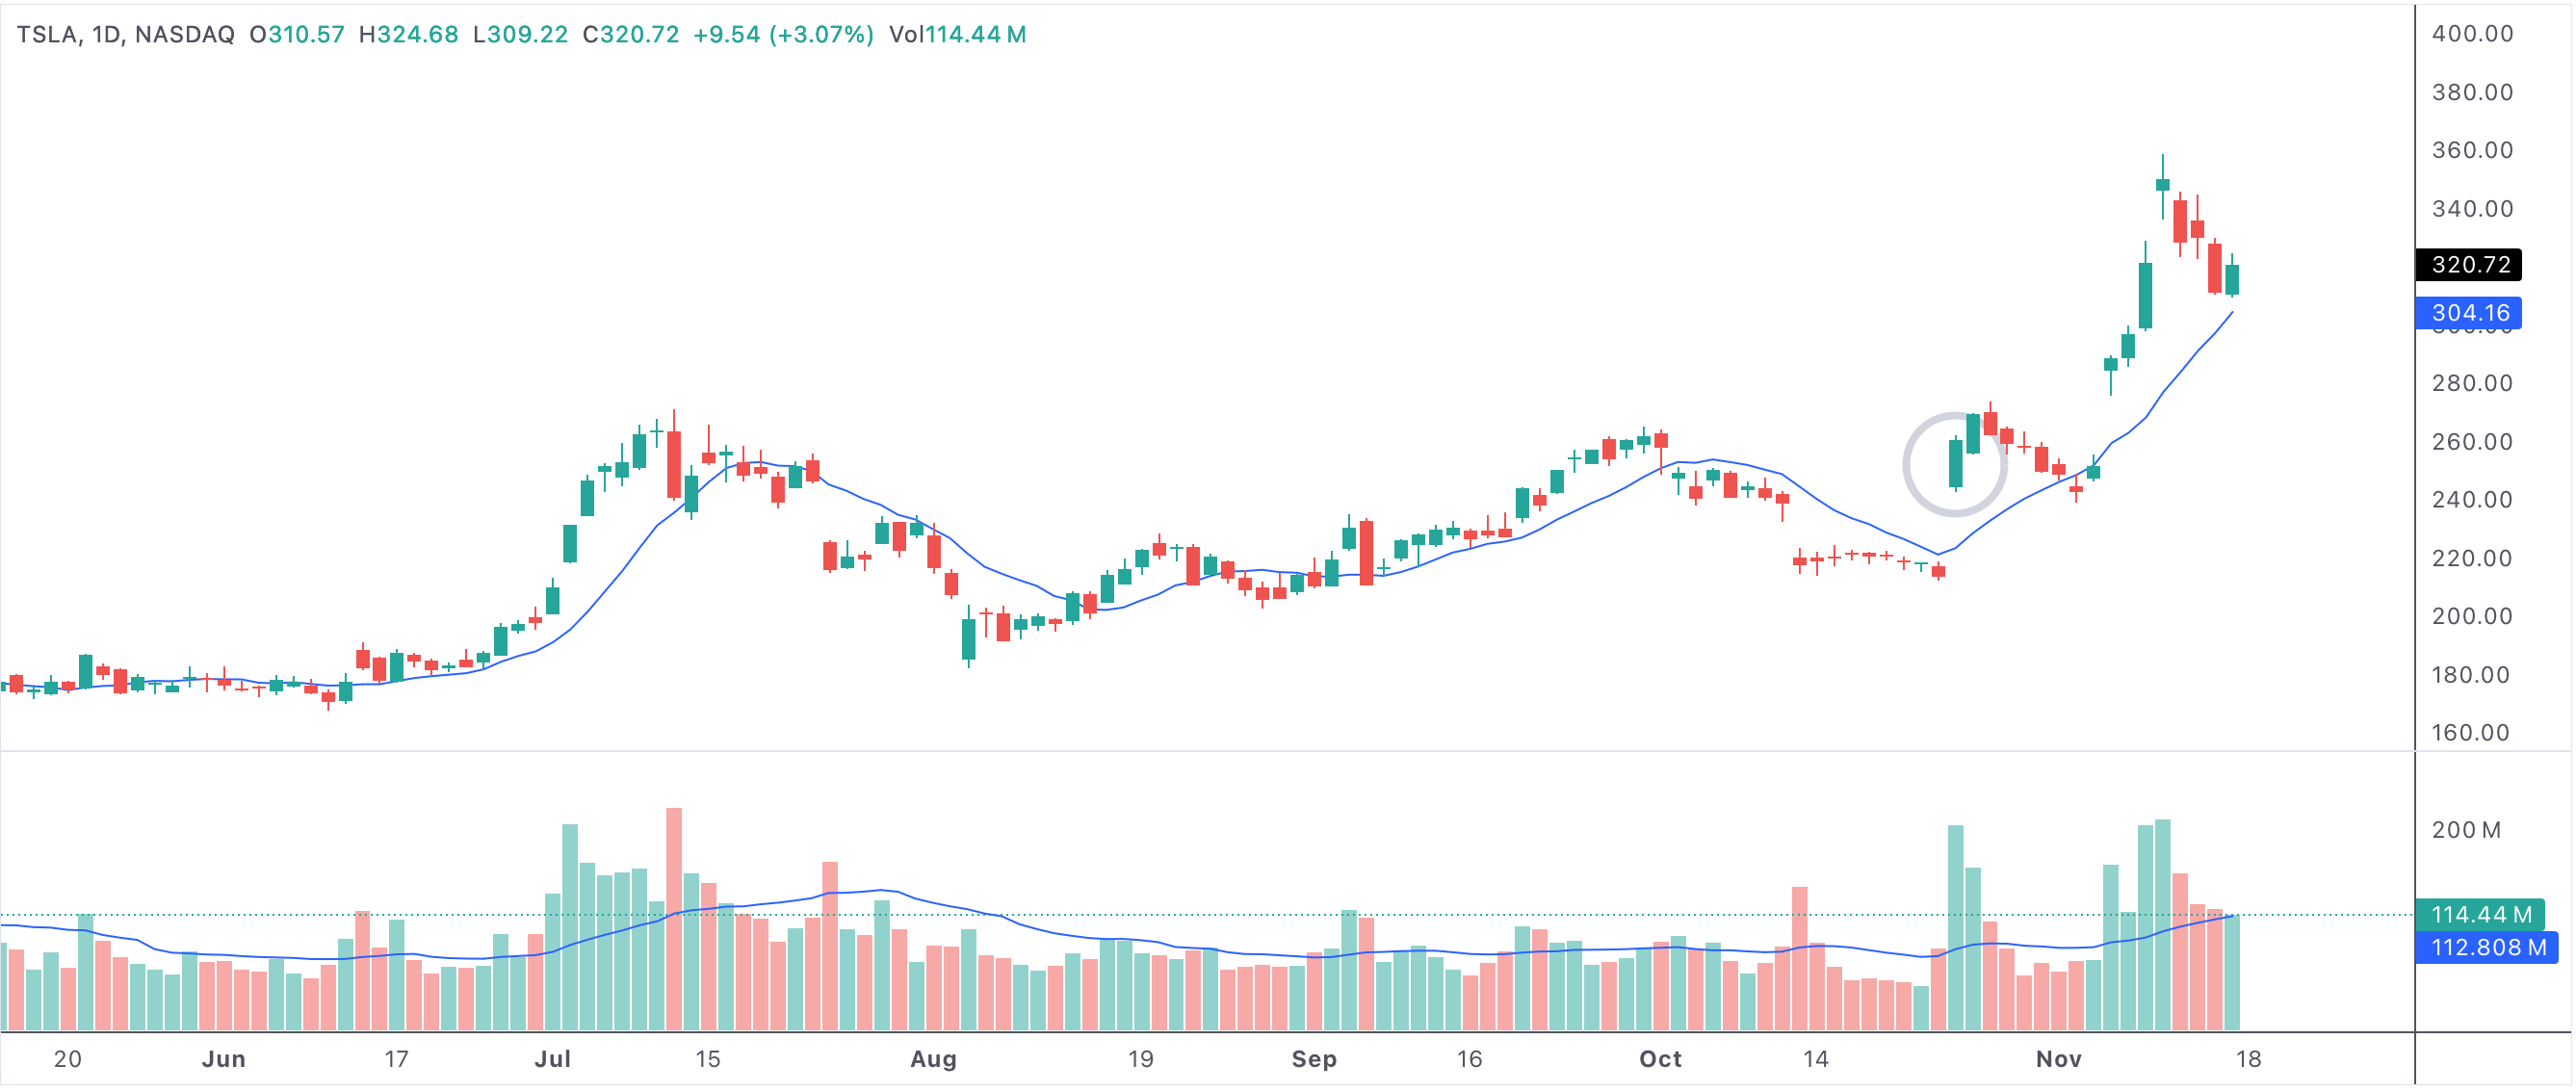
First Day Above 10 SMA
Example: a stock closes above its 10-day SMA after a prolonged decline, often a sign of renewed buying interest and a shift in market momentum.
First day above 10 SMA after longest consecutive days below
Why This Setup Matters
After a stock has remained below its 10 SMA for many days, traders watch closely for the first close back above this moving average. It’s a classic signal that the short-term trend could be turning, especially if the breakout happens on increased volume. Technical traders and swing traders often see this as a possible entry point for a new bullish phase.
Surpassing the 10 SMA after a long stretch of weakness suggests that downward momentum has stalled. If volume picks up alongside the move, it reflects growing confidence from buyers, helping to confirm the shift in sentiment. Many traders consider the 10 SMA a key level for identifying short-term reversals or the start of new rallies.
- First close above 10 SMA after many days below signals a potential momentum shift.
- Often marks easing selling pressure and early signs of a price recovery.
- Stronger volume can confirm renewed buying interest and a bullish outlook.
- Technical traders view this move as an entry opportunity at the start of a rally.
- If momentum builds, this setup can spark a short-term trend reversal.
How to Trade This Signal
To increase confidence, look for confirmation from other indicators (such as RSI turning higher or a volume surge). Manage risk with stop-losses just below the recent lows, since not every move above the 10 SMA leads to sustained gains. This pattern works best when overall market sentiment is stable or improving.
In summary, the first day above the 10 SMA after a long down stretch is a classic bullish technical signal. It often draws in momentum traders and can be the first step toward a new upward move.