First Day Above 200-Day SMA After Longest Downtrend - Bullish Reversal Signal
The first day above the 200-day simple moving average (SMA) after an extended period below is widely recognized as a powerful technical event. For many investors and traders, this signal marks the potential end of a prolonged bearish phase and the beginning of renewed bullish momentum. As one of the most referenced long-term technical indicators, the 200 SMA carries significant weight in market analysis and investment decision-making.
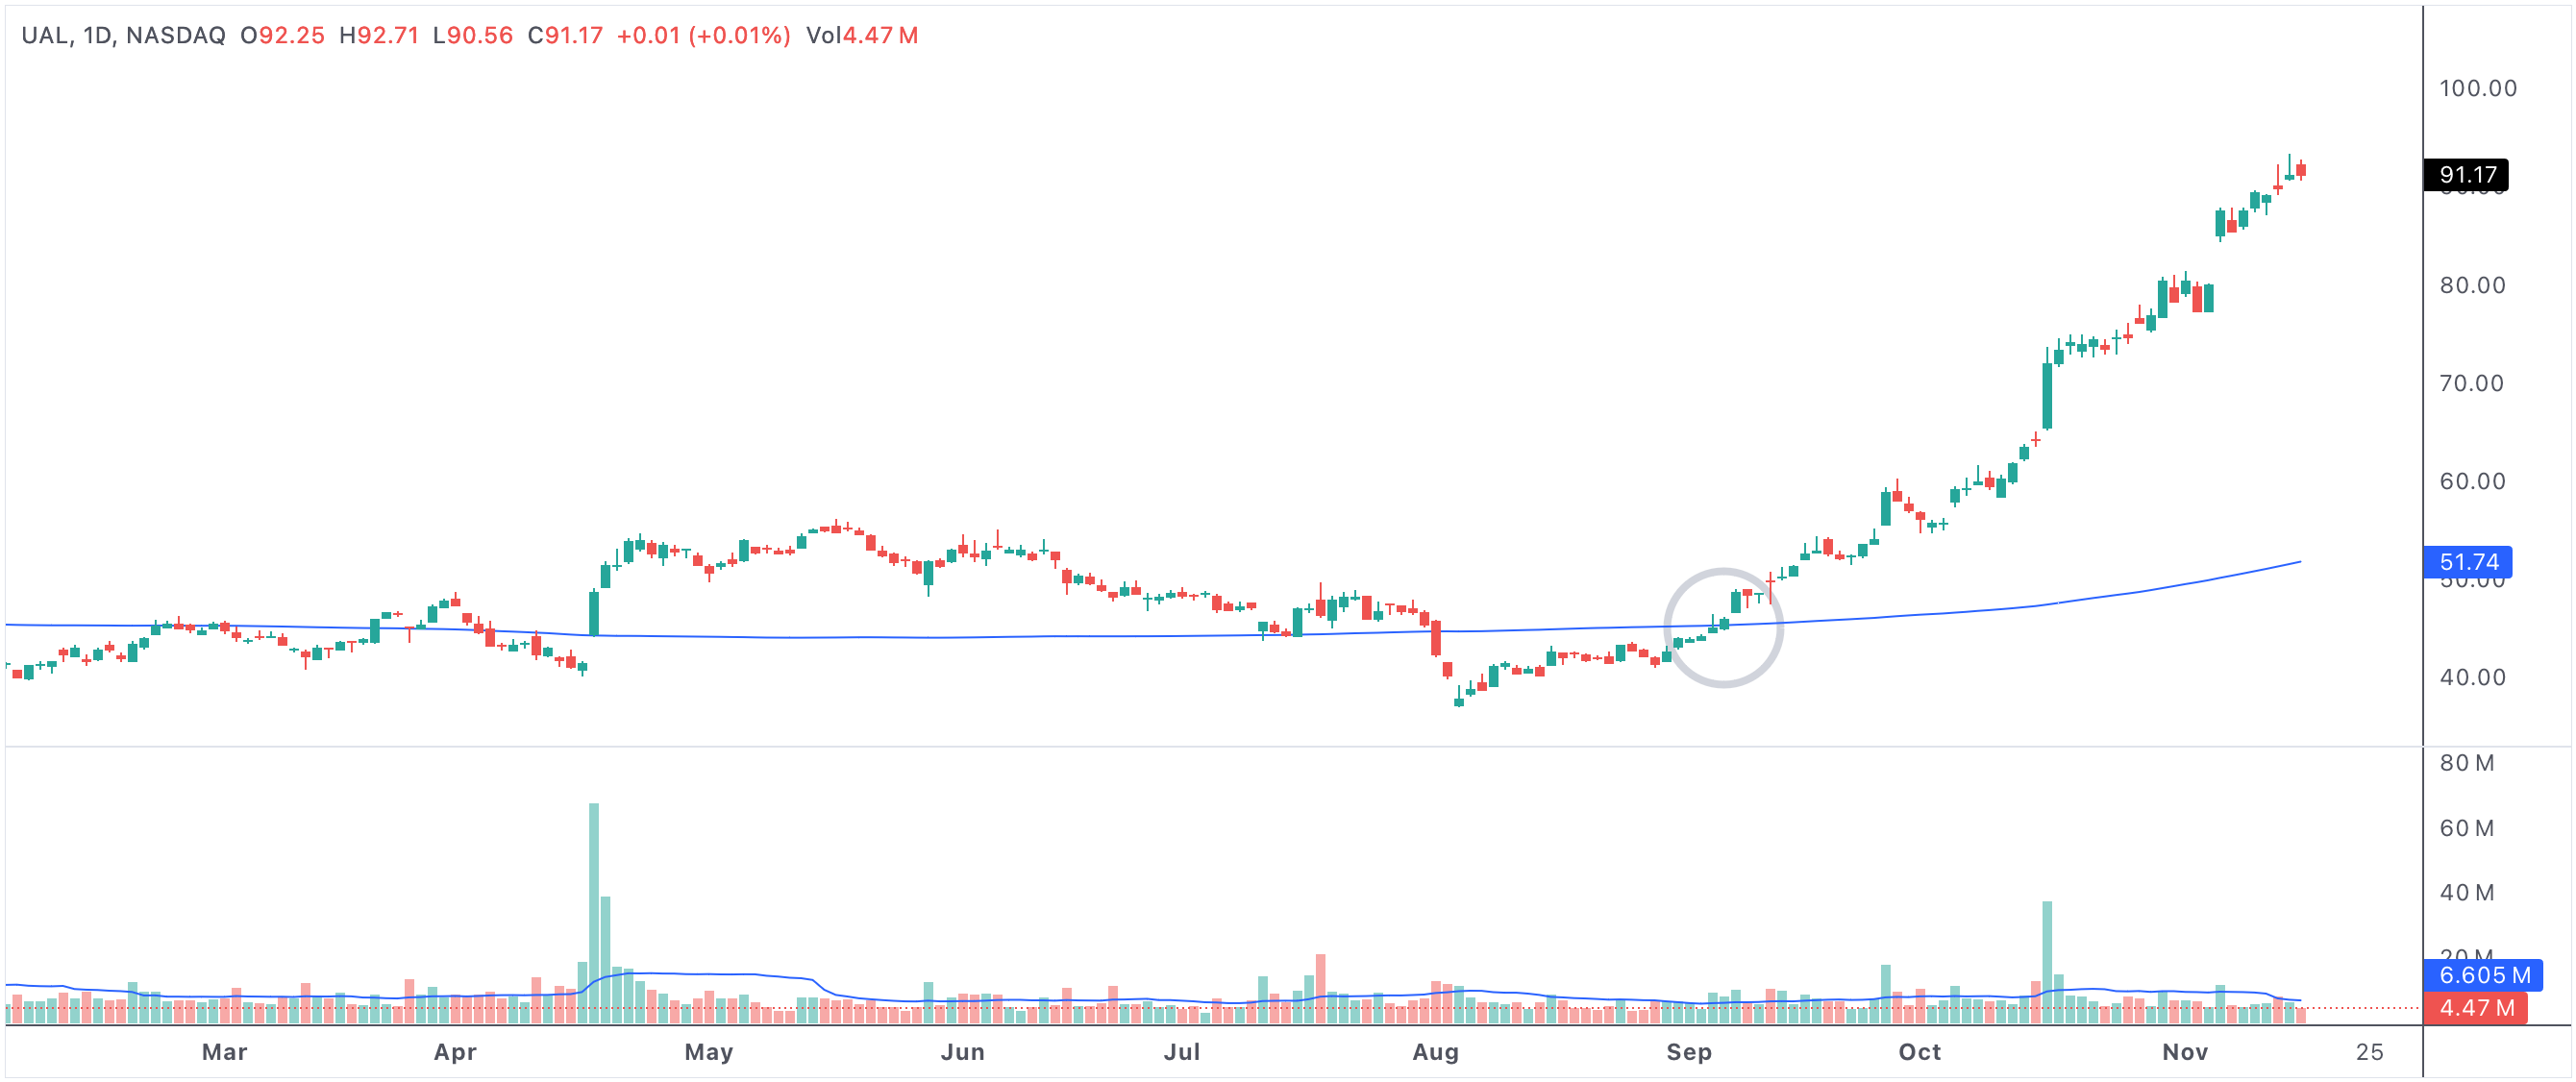
day1gt200sma
A real-world example of a stock crossing above its 200-day simple moving average.
First day above 200 SMA after longest consecutive days below
Why the 200-Day Moving Average Matters
The 200-day moving average serves as a key dividing line between long-term uptrends and downtrends. Many institutional investors and professional traders monitor this level as an indicator of the overall health of a stock or index. When a stock closes above the 200 SMA for the first time after a lengthy stretch below, it suggests that the prior downtrend may be exhausted and that buyers are regaining control.
Technical Significance of a Breakout
The move above the 200 SMA is often seen as a trend reversal signal. It means that, after enduring the longest stretch of consecutive closes below this key average, the price has finally overcome resistance and is showing new relative strength. This breakout tends to attract both short-term traders looking for momentum and long-term investors seeking confirmation of a potential shift in the stock's primary trend.
- First close above 200 SMA after a long decline signals renewed bullish sentiment.
- This move often increases investor confidence, leading to higher trading volumes and sustained buying.
- If confirmed by other indicators (like rising volume or positive MACD), it further strengthens the bullish case.
- Institutional traders frequently use this level to add to or initiate new positions.
- Sustained closes above the 200 SMA can shift market psychology from caution to optimism.
Broader Market Impact
When multiple stocks or even entire indices begin crossing above their 200-day SMAs after a market-wide downturn, it can be a sign of a broader recovery. Market strategists pay close attention to these shifts, as they may signal a turning point in sentiment and trend for the overall market. This condition is often reported in financial media and can spark increased interest from both retail and institutional investors.
Trading Strategies and Considerations
Traders using this signal typically look for confirmation, such as a retest and hold of the 200 SMA as support or an uptick in volume. Some may combine it with other technical indicators, like RSI or MACD, for added conviction. While this signal is historically reliable for identifying emerging bullish momentum, it is essential to maintain prudent risk management, as false breakouts can occur—especially during volatile market environments.
For long-term investors, the first close above the 200-day SMA after the longest consecutive days below can serve as a low-risk entry point. By waiting for this confirmation, investors seek to avoid buying too early during a prolonged downtrend and instead participate in the potential upside as confidence returns to the market.
Summary: First Day Above 200 SMA as a Bullish Signal
In summary, a stock’s first day above its 200-day SMA after the longest consecutive days below is a robust signal of positive change. It represents a technical and psychological turning point, often followed by sustained gains if confirmed by other bullish signals. Recognizing this event can help investors and traders position themselves early in a new uptrend, taking advantage of shifting momentum and growing optimism in the market.