First Day Above 50 SMA After Longest Streak Below – Bullish Signal
The first day a stock closes above its 50-day simple moving average (SMA) after the longest streak below that level is a classic technical breakout watched by traders and investors alike. This signal can represent a shift in sentiment, marking the end of a prolonged downtrend or consolidation phase and the beginning of a new bullish move. When this occurs, it often draws attention from market participants looking for signs of recovery and fresh trading opportunities.
Why the 50-Day SMA Matters
The 50-day simple moving average is one of the most closely followed indicators in technical analysis. It smooths out price data, providing a reliable view of the stock’s medium-term trend. When prices remain below the 50 SMA for an extended period, it typically reflects persistent weakness or lack of buying conviction. A close above the 50-day SMA—especially after many days or weeks below—is widely seen as a momentum shift that may spark renewed buying interest.
Example: SMA Breakout After Prolonged Weakness
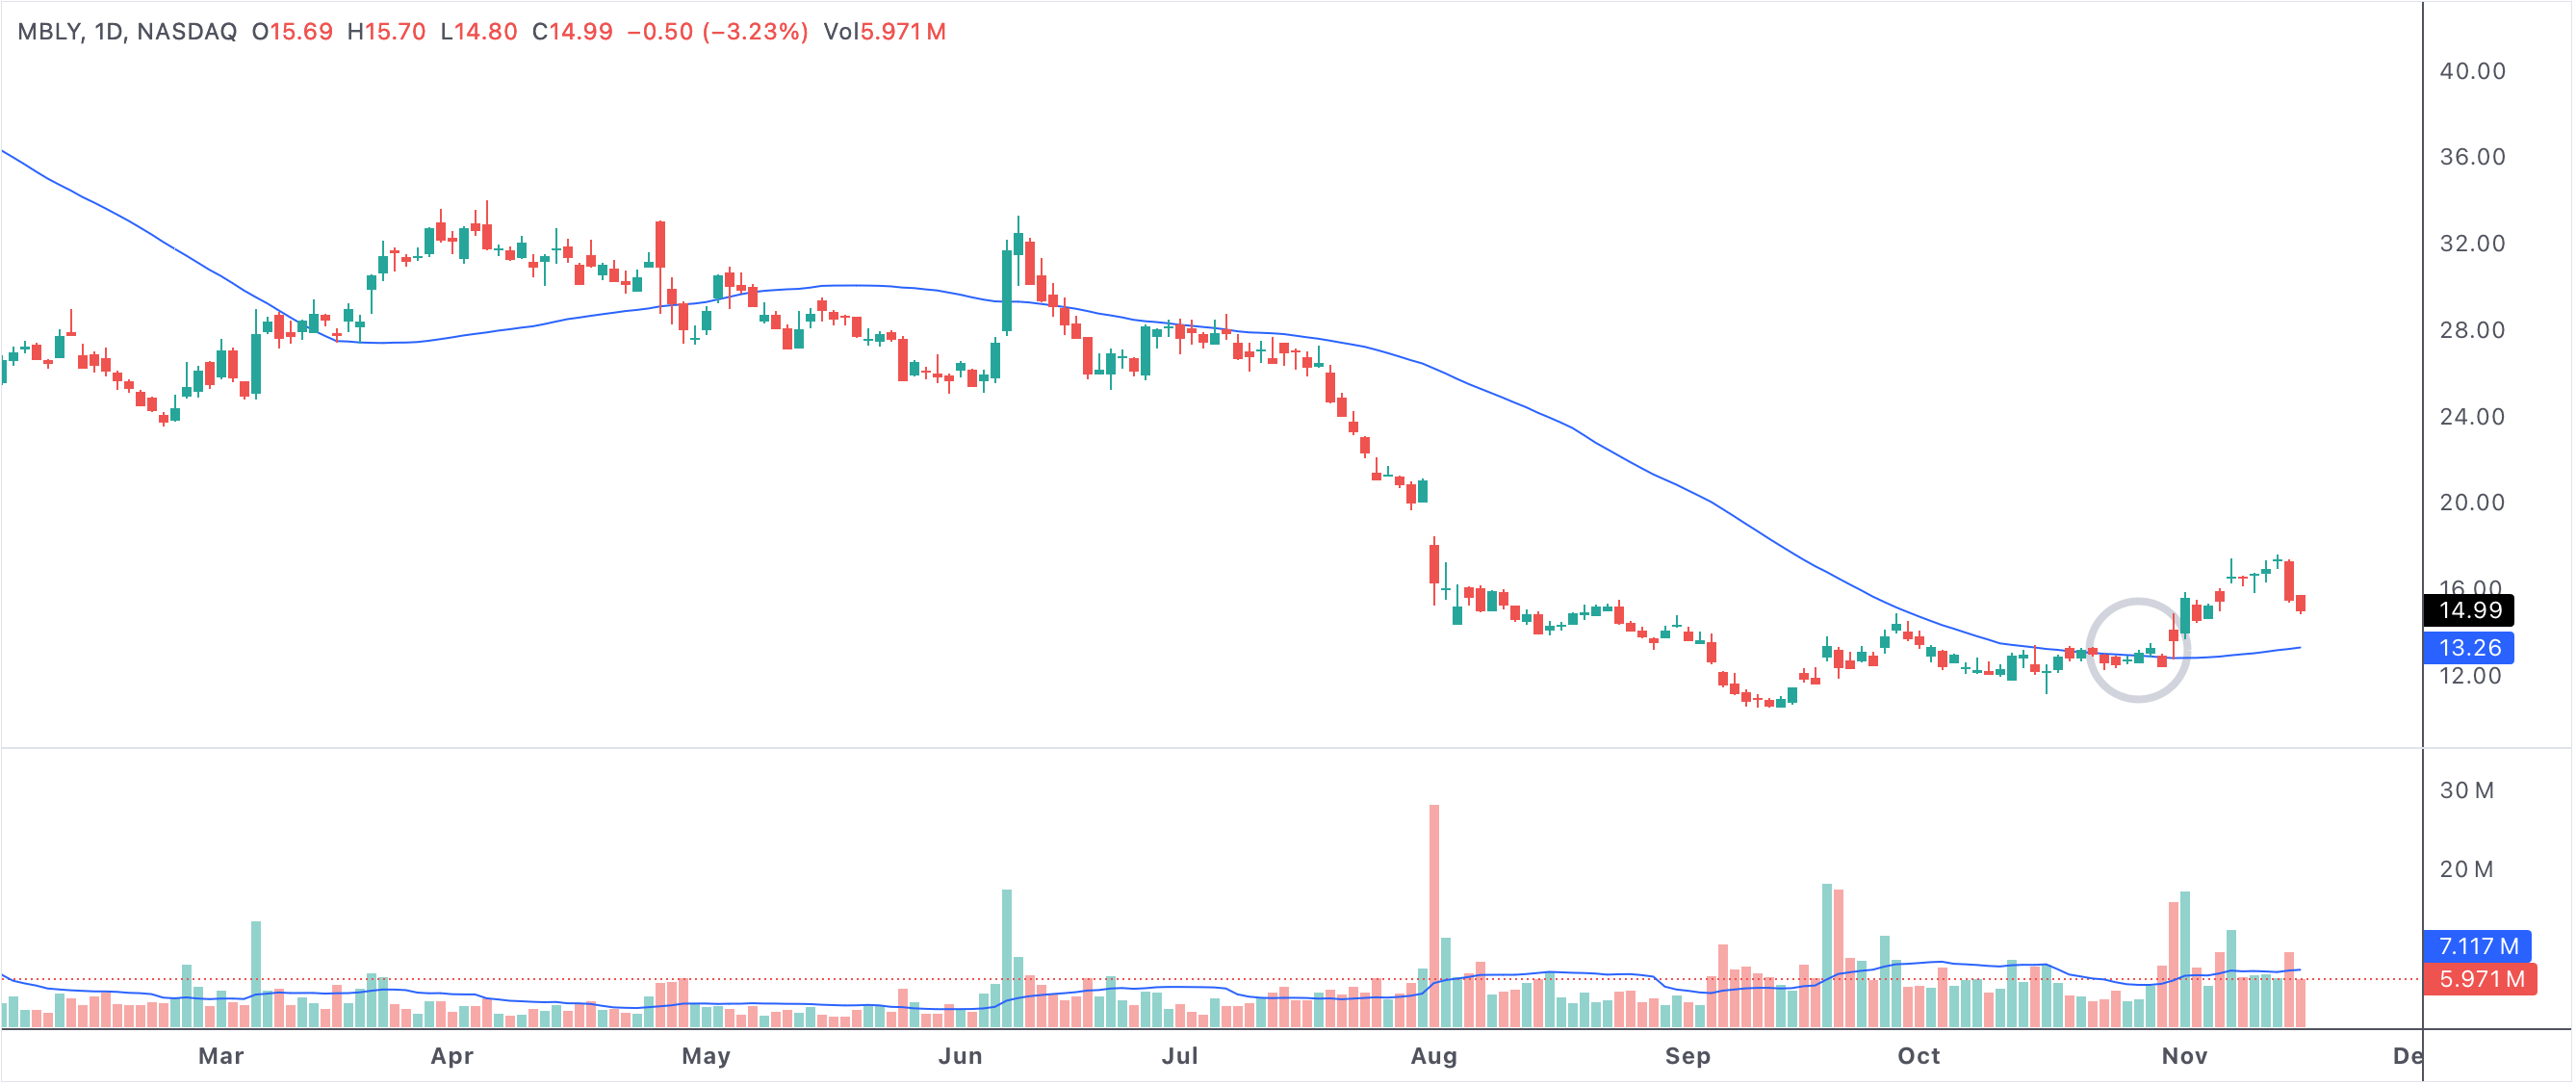
This chart highlights a stock closing above its 50-day SMA for the first time after an extended period below, signaling a possible trend reversal and new upside momentum.
First day above 50 SMA after longest consecutive days below
What Makes This Signal Bullish?
When a stock finally crosses above its 50 SMA after a long time beneath it, several factors align to make this a powerful setup. First, it suggests that sellers have lost control and buyers are starting to dominate. This breakout often comes after pent-up demand has built during the downtrend or sideways action. The move can trigger stops and new buying, further fueling upward momentum.
For many traders, this is more than just a technical event—it’s a sign that sentiment is shifting, and that the stock may be ready for a new uptrend. Breakouts above the 50 SMA often serve as confirmation for those waiting for a clear reversal signal before entering.
How to Interpret and Trade the Signal
The first close above the 50 SMA is commonly used as an initial entry point, especially for swing and position traders. Some may look for additional confirmation, such as increased volume, strong candlestick formations, or further closes above the SMA. Others act on the first signal, using tight stops to manage risk in case of a failed breakout.
This setup is most compelling when it follows a particularly long or steep decline, as the move above the 50 SMA may represent the first sign of strength in some time. Long-term investors may also take notice, interpreting this technical event as an opportunity to accumulate shares at a potential turning point.
Volume and Momentum Confirmation
Volume often plays a crucial role in confirming the strength of a 50 SMA breakout. Surging volume on the breakout day suggests broad participation and conviction among buyers. Additionally, watching for bullish momentum indicators—like rising RSI or MACD crossovers—can add confidence to the signal.
If the breakout occurs on light volume or with mixed momentum signals, traders may be more cautious, waiting for follow-through before fully committing to a position.
Risks and What to Watch For
- False breakouts can occur, especially in choppy or low-volume environments—always use risk management.
- Sharp moves above the 50 SMA can sometimes attract short-term traders, creating volatility.
- Combine the 50 SMA signal with other technical and fundamental indicators for better reliability.
- Persistent strength above the 50 SMA can confirm a sustainable trend reversal.
- This signal is most reliable after extended periods of weakness or consolidation.
Summary: A Classic Technical Turning Point
In summary, the first day a stock closes above its 50-day SMA after a long streak below is a powerful technical event, signaling a potential reversal, increased buying interest, and the possibility of a new rally. By combining this breakout with volume and momentum analysis, traders and investors can spot opportunities early and position for upside in recovering stocks.