First Day Above 50 SMA After Longest Consecutive Days Below 200 SMA Signal
Observing the first day above the 50-day simple moving average (SMA) after a prolonged streak below the 200-day SMA is a powerful technical signal that often marks a pivotal turning point in a stock’s price trend. This condition highlights a momentum shift that savvy investors and traders closely watch for potential early entry into a developing bullish trend.
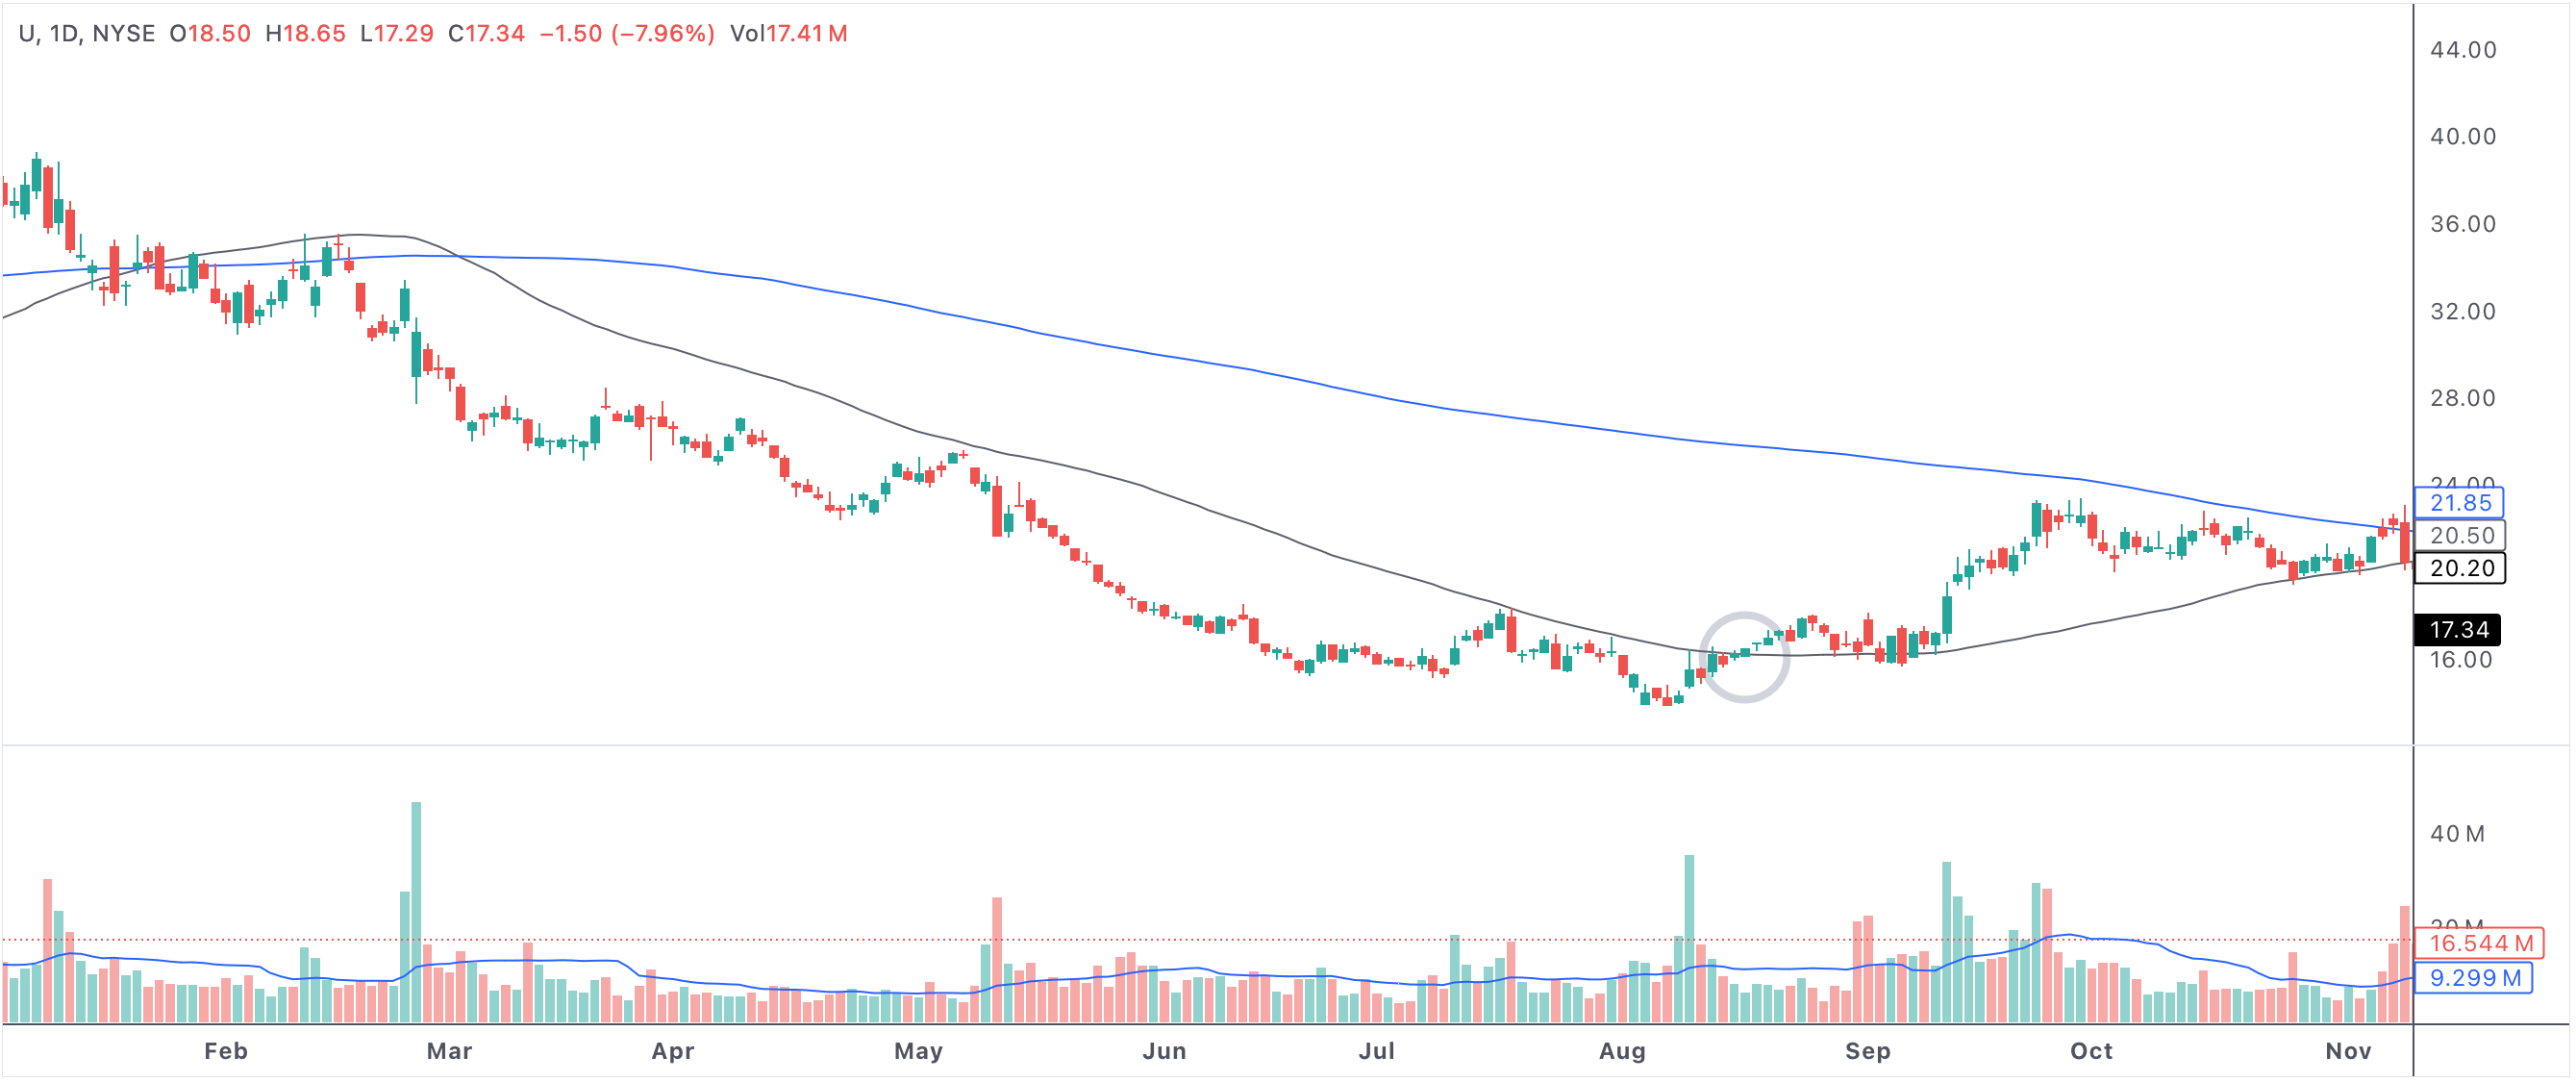
day1gt50sma_200sma
Example of a stock breaking above the 50-day SMA after a long period below the 200-day SMA.
First day above 50 SMA after longest consecutive days below 200 SMA
Understanding the Moving Averages
The 50-day SMA is a short-to-medium term trend indicator, while the 200-day SMA represents the long-term price trend. When a stock remains below the 200-day SMA for an extended stretch, it typically signals broad market pessimism and sustained downward momentum. However, a breakout above the 50-day SMA after a lengthy stay beneath the 200-day line can be the market’s first sign of optimism and recovery.
Why Is This Signal Bullish?
This pattern is considered bullish for several reasons:
- Momentum Shift: Closing above the 50 SMA after being suppressed below the 200 SMA for a record period shows that buyers are starting to take control.
- Technical Confirmation: The move can be seen as a confirmation that a bottom has been established and the prior downtrend is potentially ending.
- Institutional Interest: Many institutional investors and trading algorithms use the 50 and 200 SMA crossovers as signals for entries and exits, adding credibility to the move.
- Renewed Confidence: Investors may view this crossover as the first reliable sign of sustained strength, boosting market participation and volume.
Psychological and Market Impact
Extended periods below the 200 SMA can exhaust sellers and drive down investor sentiment. When a stock finally regains enough strength to close above its 50-day SMA, it often triggers a change in psychology. The event can attract technical traders, value investors, and momentum funds, all seeking to catch the early stages of a new uptrend. This influx of interest can lead to further gains as buying pressure intensifies.
How Traders and Investors Use This Pattern
Many traders employ this setup in their strategies as a high-probability entry signal. Some will wait for further confirmation, such as a second consecutive close above the 50-day SMA, increasing volume, or a bullish reversal candle. Others combine this signal with indicators like RSI or MACD to gauge the strength and sustainability of the new trend.
Investors might also look for fundamental support, such as improving earnings or positive sector news, to bolster the technical evidence. In either case, the crossover can serve as a clear risk management point: stops are often set just below the 50-day or 200-day SMA, keeping downside limited if the move fails.
Key Considerations and Limitations
While a close above the 50 SMA after an extended period below the 200 SMA is historically bullish, it’s not foolproof. False breakouts can occur, especially during periods of overall market volatility. Smart traders will monitor for sustained price action and volume, using additional technical and fundamental indicators to confirm the validity of the move.
Summary: Spotting Bullish Momentum Early
In summary, the first day above the 50 SMA after the longest stretch below the 200 SMA is a classic sign that the market’s tide may be turning from bearish to bullish. By watching for this crossover, traders and investors can gain an early edge in spotting trend reversals, managing risk, and capturing upside as momentum and confidence return to the stock. When combined with sound analysis, this technical condition is a valuable tool for identifying timely bullish opportunities in any market cycle.