First day below 10 SMA after record streak above warns of momentum change
The first day below the 10-day simple moving average (SMA) after the longest consecutive stretch above it is a notable technical event for traders and investors. This pattern often marks a key inflection point in market sentiment. It may either foreshadow the beginning of a trend reversal or simply signal a pause or consolidation within a larger uptrend, depending on context.
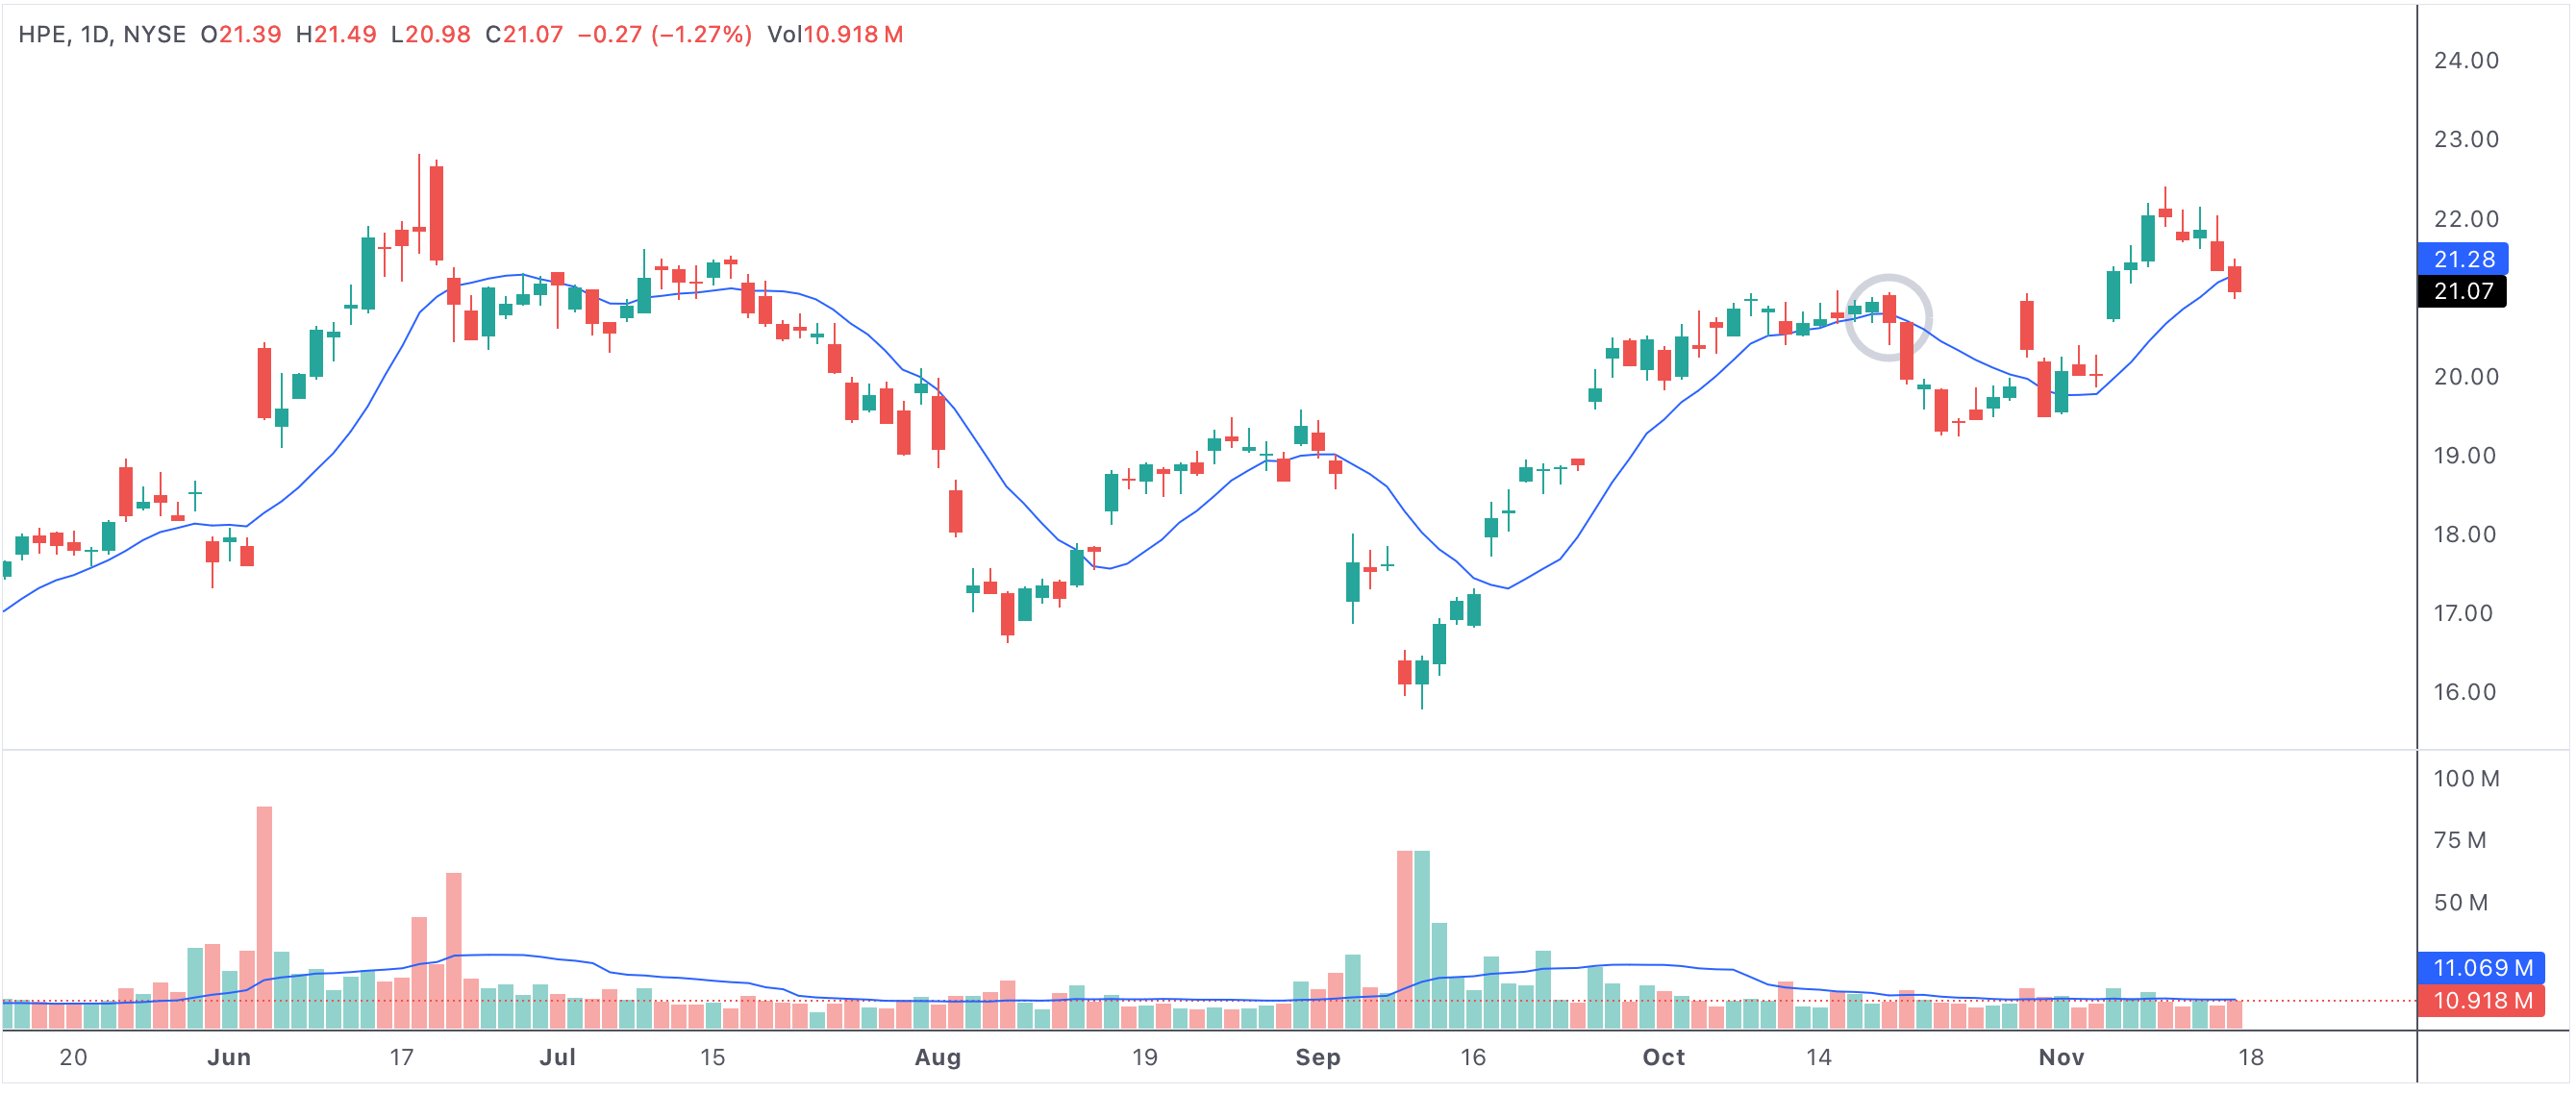
day1lt10sma
Chart example: price dips below the 10-day SMA after an extended run above it.
First day below 10 SMA after record streak above
Why the 10-Day SMA Matters
The 10-day SMA is a classic short-term indicator used to gauge the prevailing trend. When a stock stays above its 10-day SMA for many sessions, it signals persistent buying and strong momentum. Breaking below this moving average for the first time after a long streak can raise red flags for technical traders, as it implies that buying pressure is fading and the uptrend may be losing steam.
Bearish and Bullish Interpretations
Bearish case: A close below the 10 SMA following a prolonged rally is sometimes viewed as the earliest signal of a potential reversal. If this break is confirmed by increased volume or additional technical breakdowns (such as support levels failing or the price falling below longer-term moving averages), it can trigger profit-taking and selling pressure.
Bullish case: However, not all moves below the 10 SMA spell doom. If the price quickly rebounds and closes back above the average, it may only be a healthy consolidation—giving the market a chance to digest gains before another leg higher. Context, such as broader market trends and volume, is crucial for interpreting the signal.
What Makes a Record Streak Significant?
When a stock remains above its 10 SMA for an unusually high number of consecutive days, it demonstrates strong bullish conviction and trend persistence. The longer the streak, the more meaningful the first close below becomes. It indicates the first sign of real weakness after a period of sustained strength and often prompts a close examination of the underlying factors that could be driving the shift.
Volume Analysis and Confirmation
Volume is a key factor in validating the signal. A sharp drop below the 10-day SMA on higher-than-average volume often carries more weight and suggests urgency among sellers. Conversely, a minor dip on light volume may simply reflect random noise or short-term profit-taking rather than a true change in trend.
- Momentum shift: The initial break below the 10 SMA can be the first sign of lost momentum after an extended run higher.
- Bearish or bullish implications: The move’s significance depends on follow-through—further declines suggest reversal, while quick recovery suggests strength.
- Context matters: Other technical indicators, news, or market-wide moves should be considered for confirmation.
- Volume is critical: Heavier volume on the breakdown signals more conviction among sellers.
- Key for risk management: Some traders use this event to adjust stop-losses or trim positions to lock in gains.
How Traders Use This Signal
For active traders, the first day below the 10 SMA after a record streak above is a trigger to review positions. Those with profits from the rally might reduce exposure or tighten stops. Aggressive traders may look for short setups if the weakness persists, while long-term investors might simply monitor for confirmation before making portfolio changes.
Combining With Other Technical Tools
This signal is most powerful when supported by other bearish indicators—like negative divergence on oscillators (such as RSI or MACD), failing to reclaim the 10 SMA after the initial break, or broader market weakness. Alternatively, a rapid bounce back above the 10 SMA can be used as a bullish confirmation for trend continuation.
Summary: Early Warning or Routine Pause?
The first day below the 10-day SMA after the longest consecutive run above is a classic technical milestone. It can serve as an early warning for trend change or just a routine pause in a healthy uptrend. Careful context analysis and risk management are key to making the most of this important moving average signal in active trading and investing.