First down day after the longest uptrend: pullback, consolidation, or signal?
When a stock or index experiences its first down day after the longest consecutive up days, it stands out as a critical technical event for traders and investors. This scenario often marks a turning point or at least a meaningful pause in market momentum. The relentless upward move typically draws in both momentum traders and late buyers, pushing prices further. However, markets rarely move in a straight line forever. A down day that breaks this sequence of gains raises important questions about sustainability, future direction, and investor psychology.
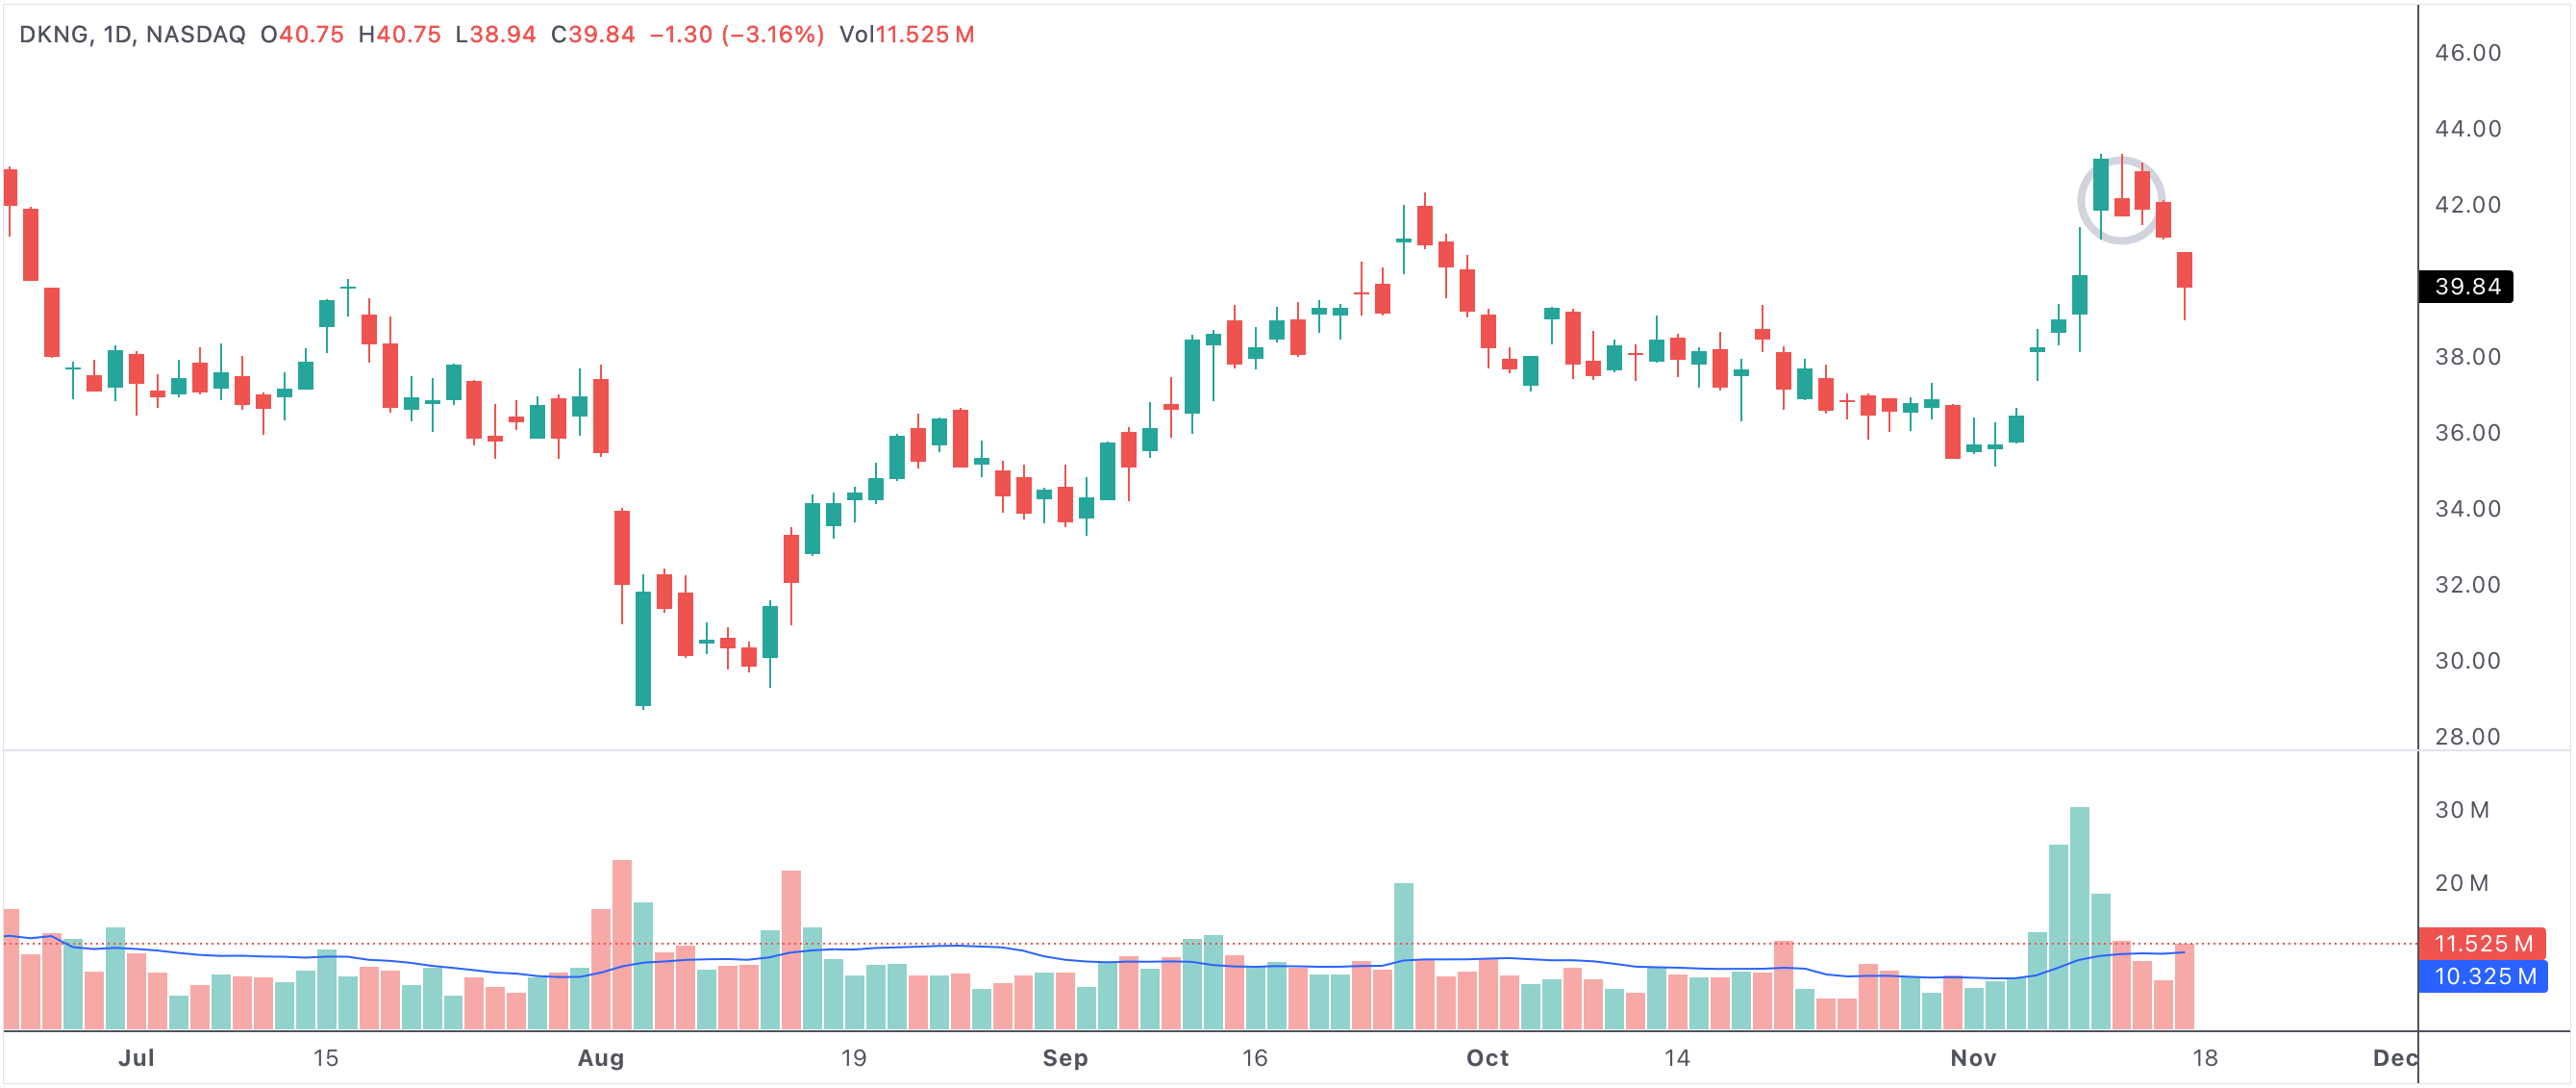
firstdownday
An example of a first down day after a series of strong up days
First down day after longest consecutive up days
Why Is the First Down Day Important?
The initial red session after a powerful run-up acts as a signal that buying momentum may be running out of steam. For technical analysts, this day is watched closely, as it can be the first sign of profit-taking. Many investors may use the streak of up days as an opportunity to lock in gains, especially when a rally becomes overextended or diverges from underlying fundamentals. The transition from a series of gains to a single down day is often not a reversal on its own, but it can serve as a precursor to a more meaningful consolidation phase—or even a potential trend change if selling accelerates.
Possible Outcomes: Pullback, Pause, or Bullish Continuation
Not all first down days are created equal. Sometimes, the down day is just a natural pause after strong momentum, reflecting short-term exhaustion and encouraging consolidation. In this case, prices may drift sideways or retrace modestly as the market digests gains and prepares for the next move higher. If broader market conditions remain positive—supported by bullish sentiment, strong earnings, or macroeconomic tailwinds—the dip often attracts new buyers who missed the earlier rally.
Conversely, if the down day is accompanied by high volume, negative news, or technical breakdowns below key support levels, it may signal the start of a deeper correction or even a trend reversal. Savvy traders look for confirmation from additional technical signals, such as moving averages, RSI turning down, or other indicators suggesting weakness.
What Are Traders and Investors Looking For?
Price action following the down day is crucial. If prices quickly recover and make new highs, it confirms that bullish sentiment remains dominant. A short pullback may simply reset overbought conditions and allow the uptrend to continue with fresh energy. On the other hand, if selling pressure persists or accelerates, traders may interpret this as the beginning of a larger pullback or correction. Some investors view the initial weakness as a buying opportunity, while others see it as a warning to take profits or tighten stops.
Psychology Behind the Pattern
The psychology around the first down day after a winning streak is nuanced. Bulls who participated in the rally may hesitate to sell on a single weak day, especially if the broader narrative remains positive. However, the first red candle introduces doubt and can spark short-term volatility as some market participants rush to lock in gains. Bears, on the other hand, may see the down day as the first crack in the uptrend, providing an opportunity to initiate short positions or wait for additional confirmation of weakness.
- First down day after an uptrend can indicate profit-taking or market exhaustion.
- If the broader trend remains bullish, a minor pullback often acts as healthy consolidation.
- A failure to quickly recover may foreshadow a larger correction or a change in market sentiment.
- Volume, news, and key technical levels provide critical context for interpreting the signal.
- Astute traders look for confirmation in subsequent days before making major decisions.
In summary, the first down day after a sequence of consecutive up days is a classic technical signal watched by traders and investors alike. While it often marks a healthy pause and opportunity for consolidation, it can also serve as the first warning of trend exhaustion or potential reversal. By analyzing price action, volume, and related indicators, market participants can better gauge whether the pullback is a temporary pause—or the start of a more significant move.