First UT Bot Buy Signal After Sell Streak – Early Bullish Reversal Setup
The first UT bot buy signal after the longest consecutive sell days can mark a key turning point for traders and investors. This technical event often signals a potential bullish reversal, as it indicates a shift in sentiment from persistent selling to renewed buying interest. After an extended downtrend, the first buy signal from the UT bot is closely watched by those searching for early signs of recovery and undervalued opportunities.
What Is the UT Bot Buy Signal?
The UT bot is a popular algorithmic indicator used by traders to spot trend changes in stocks and other financial instruments. A "buy" signal from the UT bot typically appears when price action and momentum conditions align to favor a possible upside move. When this buy signal comes immediately after a record streak of consecutive sell days, it highlights a potential change in direction and market psychology. It’s a signal that sellers may be exhausted and buyers are starting to step back in, making it a possible early entry point for bullish traders.
Example: UT Bot Buy After Sell Streak
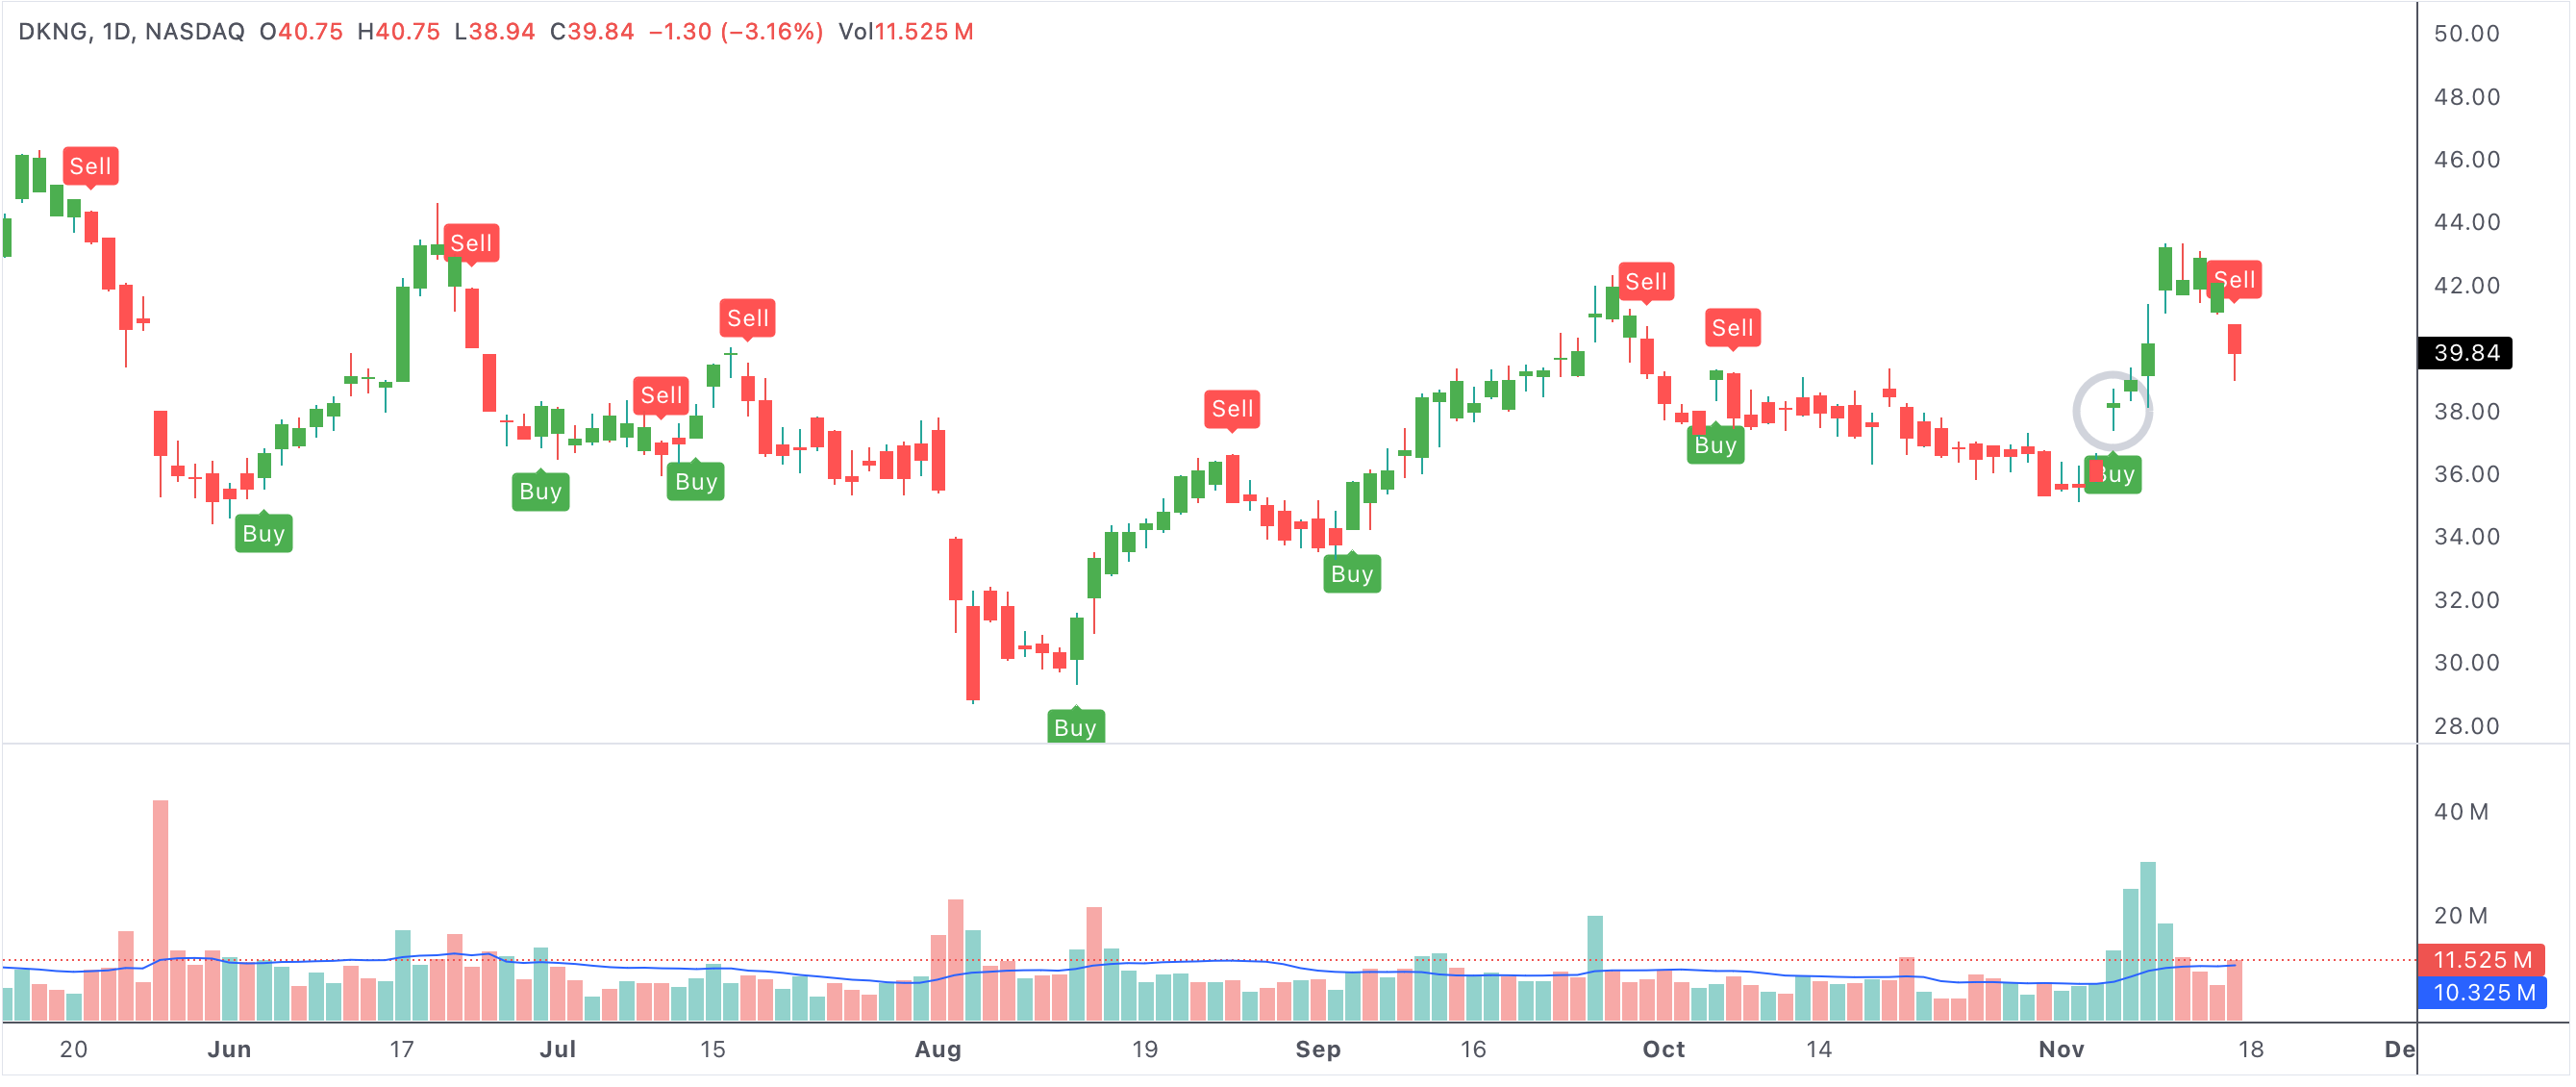
This chart highlights a stock generating its first UT bot buy signal after a series of down days, marking the start of a possible bullish reversal.
First UT bot buy day after longest consecutive sell days
Why Consecutive Sell Days Matter
When a stock experiences multiple days of consecutive selling, it usually signals strong downward momentum and negative sentiment. However, as the sell streak extends, sellers may become exhausted, and the stock may reach oversold or undervalued territory. This is often when reversal traders begin to look for a change in momentum. The first UT bot buy day after such a streak is seen as a possible indication that selling pressure is finally easing and a trend reversal could be underway.
Long sell streaks can also attract value investors and contrarian traders who are willing to buy when most others are selling. If the UT bot triggers a buy signal at this point, it further confirms the possibility of a bottom and growing demand at lower price levels.
How Traders Use This Signal
Technical traders often view the first UT bot buy signal after an extended sell-off as a tactical entry point. They may combine this signal with other technical indicators—such as increasing trading volume, bullish candlestick patterns, or positive divergence on momentum oscillators—to gain more confidence in the setup. Some will also watch for confirmation from broader market trends or news events that could justify a rebound.
For risk management, traders typically set stop-loss orders just below recent lows to limit downside in case the signal fails. If the reversal holds, early buyers can benefit from a powerful move as other investors recognize the changing trend and jump in.
The Psychology Behind Seller Exhaustion
After a string of losses, many investors may have capitulated and exited their positions, leaving fewer sellers in the market. This "seller exhaustion" effect creates an environment where it takes less buying activity to move the price higher. The first UT bot buy signal acts as a catalyst, alerting market participants that the worst of the decline may be over. As confidence rebuilds, buyers step in, and momentum can quickly shift to the upside.
Benefits and Risks of Trading This Pattern
- First UT bot buy signal after a sell streak may indicate a major sentiment shift.
- Can mark the early stage of a bullish reversal and new trend.
- Combining the signal with volume or other technicals adds reliability.
- Value investors may enter at discounted prices after capitulation.
- False signals are possible—risk management and confirmation are crucial.
Conclusion: Spotting Early Reversal Opportunities
In summary, the first UT bot buy day after the longest consecutive sell days is a unique and powerful technical signal. It combines the exhaustion of sellers with the first sign of renewed buying, offering a compelling setup for traders and investors seeking to capitalize on reversals. By combining this signal with other indicators and solid risk controls, you can spot undervalued opportunities and participate in potential trend changes at the earliest stages.