Green day then bearish 2-down breakout with a green bar signals reversal
A green day followed by a bearish breakout 2-down with the bar itself green is a subtle chart formation that often goes unnoticed by inexperienced traders but can provide early clues to a potential bullish reversal. This pattern, which combines a prior session's strength (green day) with a technically bearish “2-down” move, yet finishes with a green bar, creates a unique setup for technical analysis and trading strategies.
greengreenbear
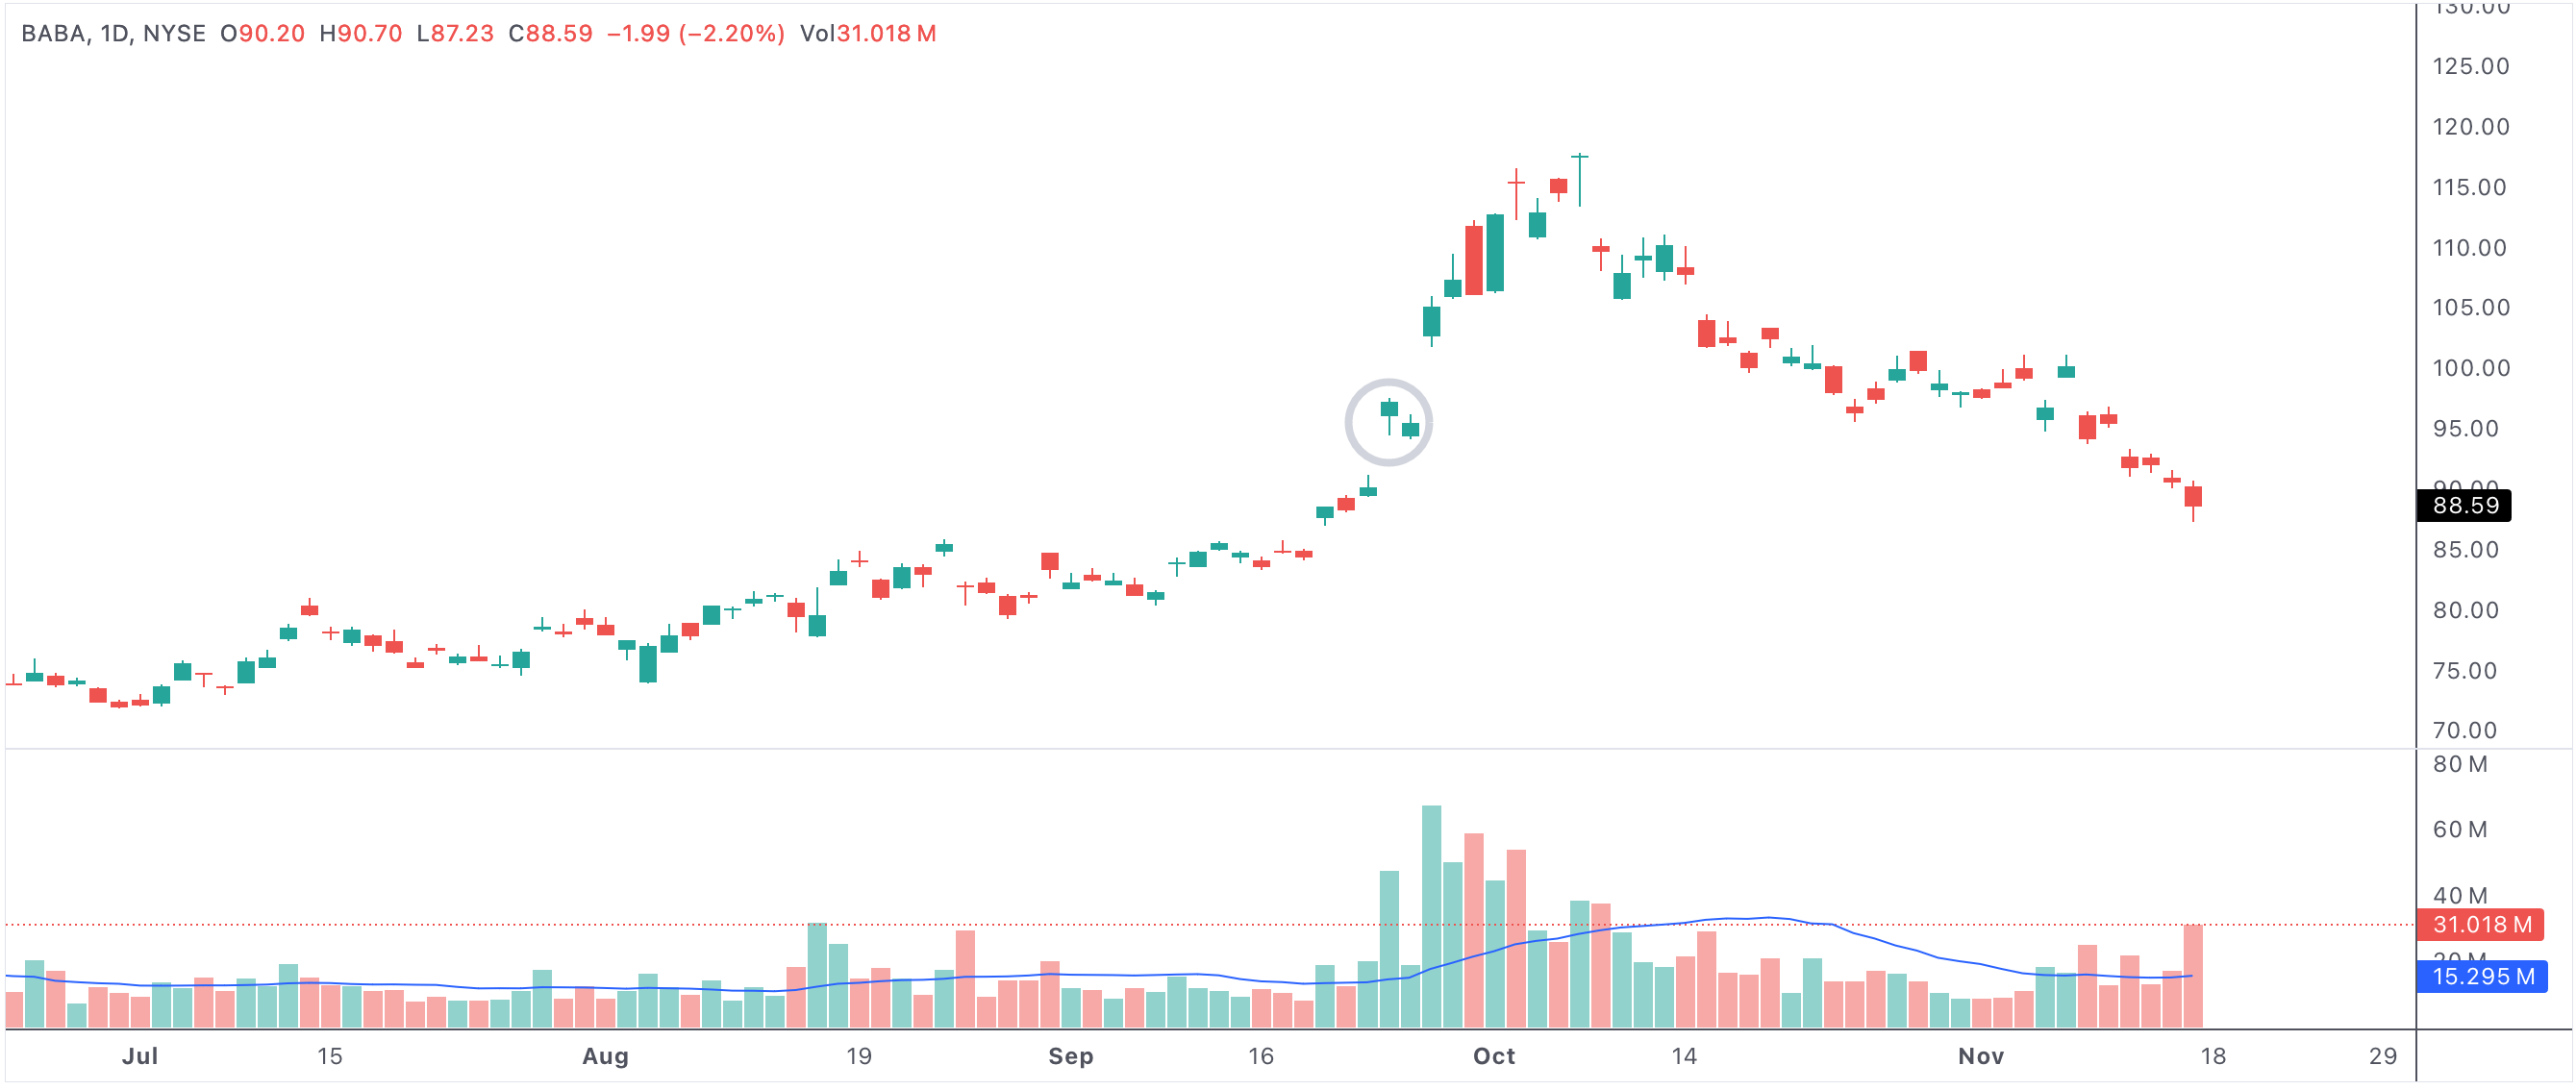
Example: a green day followed by a bearish breakout 2-down, with the bar itself green
Green day followed by a bearish breakout 2-down with the bar itself green
Pattern Breakdown: What Does It Mean?
The first part of this setup is a classic green day—a session where the stock closes higher than it opened, showing clear buying interest. On the following day, the price action dips below the previous day’s low (a bearish “2-down” breakout), which traditionally suggests increased selling pressure or a continuation to the downside.
However, the twist in this setup is that the 2-down breakout bar ends green: it closes above its own open, even if still below the prior close. This tells traders that buyers stepped in and overwhelmed sellers after the initial breakdown, quickly reversing the momentum back to the upside. It’s a visual representation of a failed breakdown—a key element for reversal traders.
Why Is This Setup Important?
Many reversals start with what appears to be a continuation of weakness. When a bearish signal—like a 2-down breakout—gets reversed within the same session and the bar closes green, it can indicate that sellers have lost conviction, while buyers are showing strength and are ready to defend a support area. This often marks the beginning of a shift from a bearish phase to a potential new uptrend.
- Green day demonstrates strong buying interest.
- 2-down breakout usually suggests continued selling pressure, but a green close disrupts this narrative.
- Green bar after the breakdown reveals hidden buying and failed follow-through from bears.
- This combination is an early signal for a potential bullish reversal, especially at known support levels or after a downtrend.
Volume and Context: Keys to Reliability
Context is everything. This setup is most significant when it forms near major support, after a period of selling or consolidation, or when the breakdown occurs on lower-than-average volume. Low volume suggests that sellers are not fully committed, increasing the odds that buyers can regain control.
Additionally, if the reversal green bar occurs with a spike in volume, it strengthens the signal—indicating aggressive buying and renewed interest in the stock. Volume analysis in tandem with this pattern can help filter false signals and provide greater confidence in a reversal scenario.
How Traders Use the Pattern
Savvy traders often watch for confirmation after the setup appears. Entry triggers may include a break above the high of the green reversal bar or additional green closes in subsequent sessions. Stops are commonly placed just below the low of the green 2-down bar to manage risk in case of further weakness.
This formation is also popular with swing traders looking to catch reversals at the end of corrections or downtrends. When combined with other bullish signals—such as oversold oscillators, positive divergences, or supportive fundamentals—the setup can mark the start of a new short-term or even longer-term uptrend.
Real-World Examples and Strategy Notes
Stocks that have experienced prolonged selling, but show this failed 2-down with a green close, may be in the process of bottoming out. Watch for this signal in popular names after earnings, during market corrections, or in sectors rotating from weakness to strength.
It’s also valuable for investors who prefer to scale in, as it provides an early warning of potential sentiment change before a more obvious breakout occurs. This allows for a better entry price and improved risk/reward ratio.
Conclusion: Turning Weakness Into Opportunity
The green day followed by a bearish breakout 2-down with the bar itself green pattern is a sophisticated reversal clue for traders and investors. It reveals a market where sellers tried to continue lower but buyers decisively stepped in. Used in the right context, it can lead to excellent opportunities for those who recognize the psychological battle on the chart—and are prepared to act when weakness fails to materialize into a true breakdown.