Green day then bullish breakout 2-up with green bar signals momentum and strength
A green day followed by a bullish breakout 2-up where the bar itself is green represents a powerful momentum shift in stock price action, catching the attention of technical traders and market participants. This sequence typically signals strong buyer confidence, renewed optimism, and the potential for continued upward movement, especially when it emerges after a period of consolidation or as part of an established uptrend.
greengreenbull
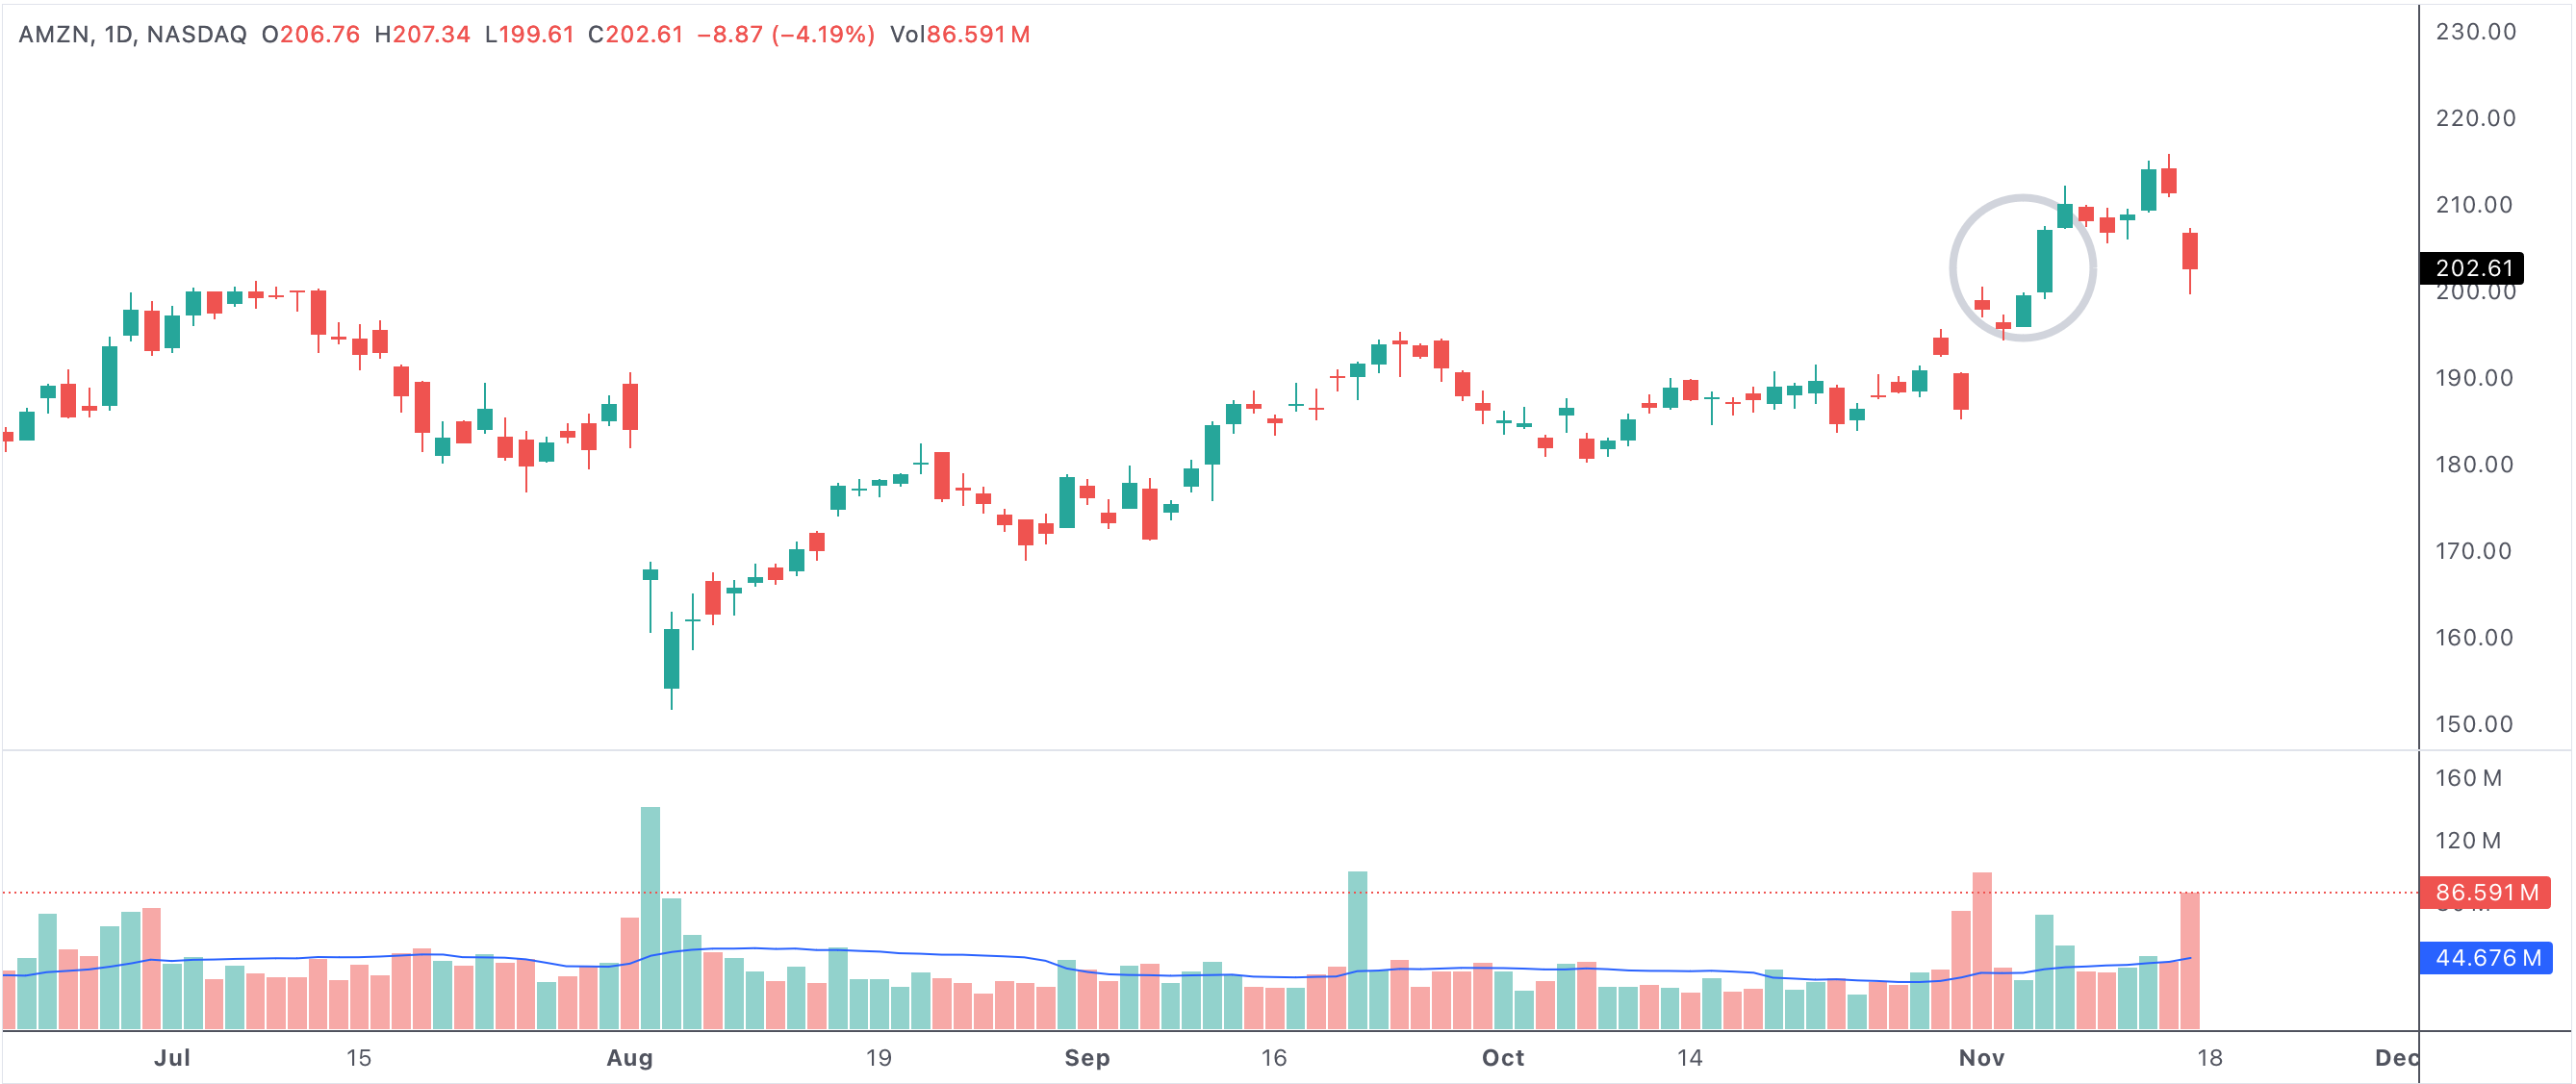
An example of a stock with a green day followed by a bullish breakout 2-up with the bar itself green
Green day followed by a bullish breakout 2-up with the bar itself green
Understanding the 2-Up Breakout Pattern
The “2-up” breakout refers to a candlestick bar that opens and closes higher than the previous day, forming a higher high and a higher low. When this 2-up bar is green—meaning the stock closes higher than it opens—the bullish implications are even stronger. Following a green day, this sequence highlights building buying pressure, clear market strength, and the willingness of traders to step in at increasingly higher prices.
Why Is This Formation Bullish?
This two-day pattern stands out because it demonstrates both consistency and escalation in buyer interest. The initial green day serves as an early indicator of positive sentiment, often breaking a resistance or signaling the end of consolidation. The subsequent green 2-up breakout confirms that demand is outpacing supply, as buyers not only sustain upward momentum but also push prices beyond previous highs. In this environment, market participants may view the move as a sign of further gains and a reliable signal for uptrend continuation.
Volume and Market Context Matter
Volume is a crucial confirming factor for this pattern. A bullish breakout on increased trading volume strengthens the signal, as it shows broad participation and conviction among both retail and institutional investors. Technical traders pay close attention to volume spikes during these breakouts, interpreting them as evidence that the momentum shift has strong support. If the pattern forms near support levels or following a period of sideways price action, the bullish implications are even more compelling.
Trading Implications and Strategy
Many traders use this green-to-green breakout pattern to identify ideal entry points for momentum trades. After spotting the sequence, some may enter on the close of the 2-up breakout or wait for confirmation with a further move higher the next day. Stop-losses are commonly set just below the low of the breakout bar to manage risk. The pattern is also useful for swing traders looking to capitalize on short-to-intermediate trend continuations, as well as day traders seeking strong, directional moves.
It’s important to consider the overall market trend, nearby resistance levels, and other technical indicators such as moving averages or relative strength. When these tools align, the probability of a successful bullish continuation increases.
Psychological Impact and Market Sentiment
This bullish setup has a psychological effect as well: as more traders recognize the strength of a green 2-up breakout, they may rush to enter positions, creating a self-fulfilling prophecy that pushes prices higher. The visible dominance of buyers over two consecutive sessions helps shift sentiment, making it more likely that sidelined traders and investors will join the move, further fueling the uptrend.
Key Takeaways
- Green day followed by a bullish 2-up breakout signals a strong shift toward bullish momentum.
- Pattern reflects increasing buyer confidence and may precede further upward movement.
- Confirmation through high trading volume adds credibility to the bullish signal.
- Often seen as a reliable entry point for technical traders and momentum investors.
- Alignment with the overall trend and other technical indicators can enhance success rates.
In summary, this two-day pattern is a powerful signal of sustained buying interest, offering traders a clear setup to participate in continued uptrends. When supported by volume and broader market strength, a green day followed by a bullish breakout 2-up with the bar itself green can become one of the most actionable technical patterns for capturing upside in stocks.