Green day then bullish 2-up breakout with a red bar signals trend reversal
A green day followed by a bullish breakout 2-up with the bar itself red is a nuanced chart pattern that can signal a subtle yet powerful shift in market momentum. This setup captures the interplay between buyers and sellers, often catching the eye of attentive traders who are watching for early signs of a trend reversal or an impending surge in bullish activity.
greenredbull
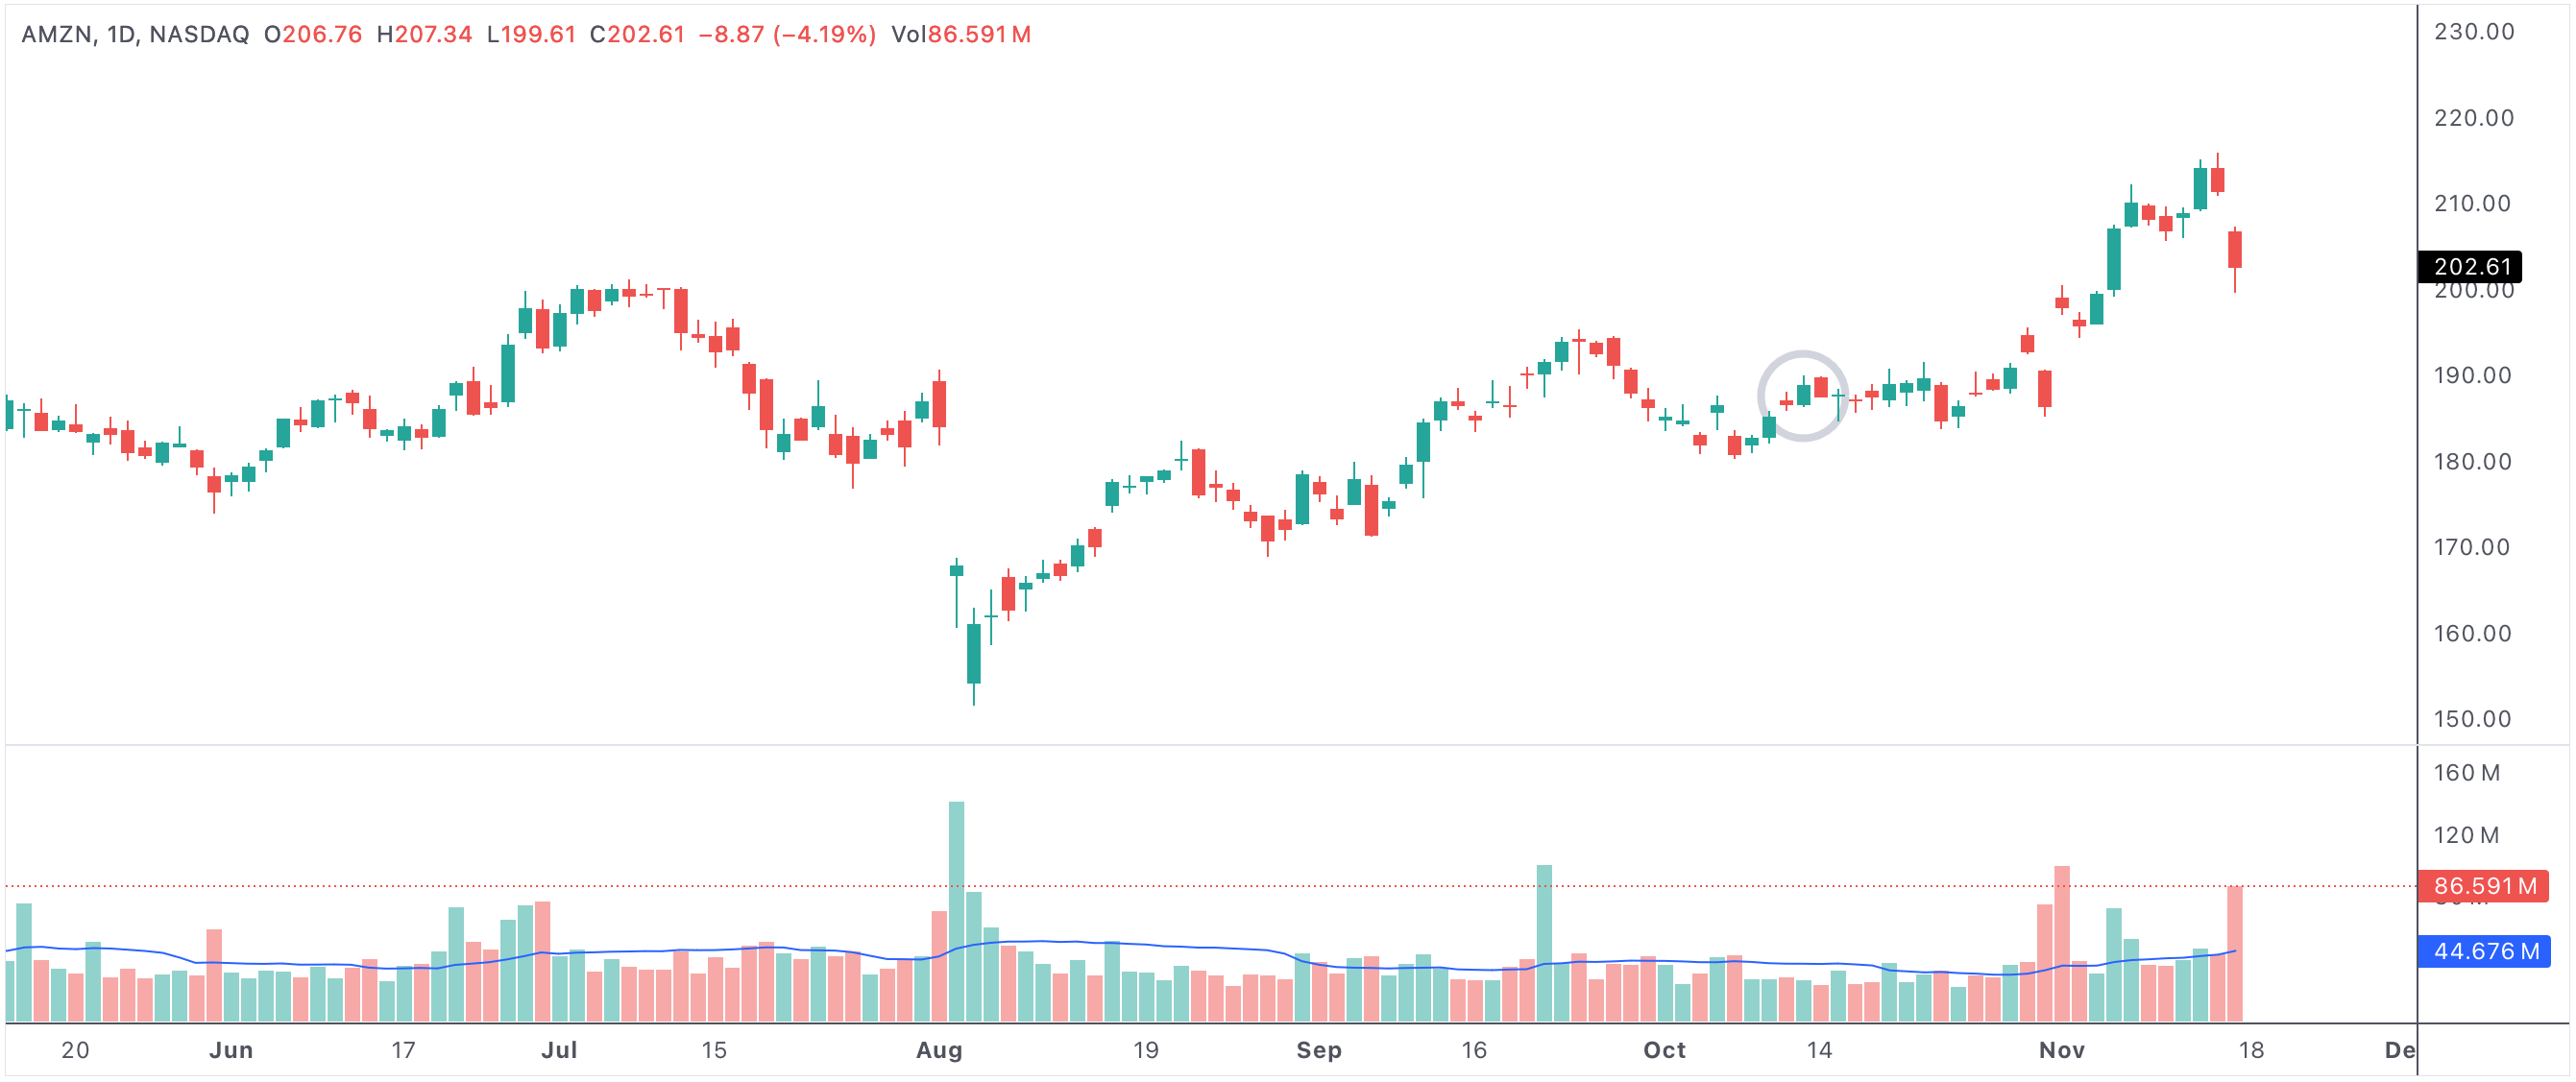
An example of a green day followed by a bullish breakout 2-up with the bar itself red
Green day followed by a bullish breakout 2-up with the bar itself red
What Does This Pattern Mean?
The first day of this two-bar pattern is a green day, where the close is above the open and market sentiment appears optimistic. The following session produces a "2-up" breakout, meaning the high of the second day exceeds the high of the previous day, confirming upward momentum. However, the twist is that the breakout bar itself is red, closing below its open despite breaking above the prior day’s high.
This mix of bullish and bearish elements creates an interesting dynamic. The red breakout bar suggests sellers were able to push the price down from the highs, but the fact that a new high was set signals that buyers are still actively engaged and accumulating shares. Often, this pattern indicates that short-term profit-taking is occurring but is not sufficient to halt a developing bullish trend.
Why Traders Watch This Setup
Many technical analysts pay close attention to "2-up" breakouts because they represent an attempt by buyers to overcome recent resistance. When the breakout bar closes red, it can serve as a shakeout—weak hands may sell, but strong hands and institutional buyers may see this as an opportunity to add positions. The combination of a green day and a red breakout bar often suggests underlying strength, even if the price action appears mixed on the surface.
- Green day shows initial buying strength and positive sentiment.
- 2-up breakout confirms buyers’ ability to push above prior highs.
- Red bar on the breakout suggests some selling or profit-taking, but not enough to negate the breakout’s strength.
- This combination may precede a period of consolidation before a sustained upward move.
Context Matters: Where This Pattern Works Best
This bullish breakout pattern with a red bar is most significant after a period of consolidation or near key support levels. When it appears in a stock that has been basing or forming a sideways range, it can indicate the early stages of a new trend. The presence of the red bar also means that traders who chase the breakout may get shaken out, providing patient buyers with a more favorable entry point.
Volume analysis can enhance this pattern’s reliability. High volume on the green day and breakout bar suggests that significant participants are involved. If volume drops off on the red breakout, it may simply be light profit-taking rather than a reversal of trend.
How to Trade the Green Day, Red Breakout Setup
Traders may look to enter on the next session after the red breakout bar, particularly if the stock holds above the prior day’s low or quickly regains upward momentum. Stop-losses are often placed just below the low of the red breakout bar. Some traders wait for confirmation, such as a close above the high of the breakout bar or a new high on increased volume.
This setup is also useful for identifying potential false breakdowns—where a stock appears weak intraday but quickly recovers. The key is to focus on the overall context: Is the stock in an uptrend, consolidating, or coming off recent lows? Patterns like these can mark the transition from sideways to trending environments.
Conclusion: Reading Between the Lines
A green day followed by a bullish breakout 2-up with the bar itself red encapsulates the struggle between buyers eager to push the stock higher and sellers taking profits or testing the strength of the move. This duality often precedes further bullish action, especially if the pattern occurs with supportive volume and in the context of a broader reversal setup. For traders and investors focused on technical analysis, recognizing the significance of this nuanced combination can provide a strategic edge in anticipating the next move.