Longest consecutive up days - bullish momentum, trend signals, and risk
The longest consecutive up days in the stock market represent a sustained rally where an asset, sector, or index closes higher for several sessions in a row. This kind of streak typically grabs the attention of traders and investors, as it highlights robust bullish momentum and widespread investor optimism. During such periods, positive sentiment often builds on itself, with each new up day attracting additional buyers who seek to ride the trend higher.
updays
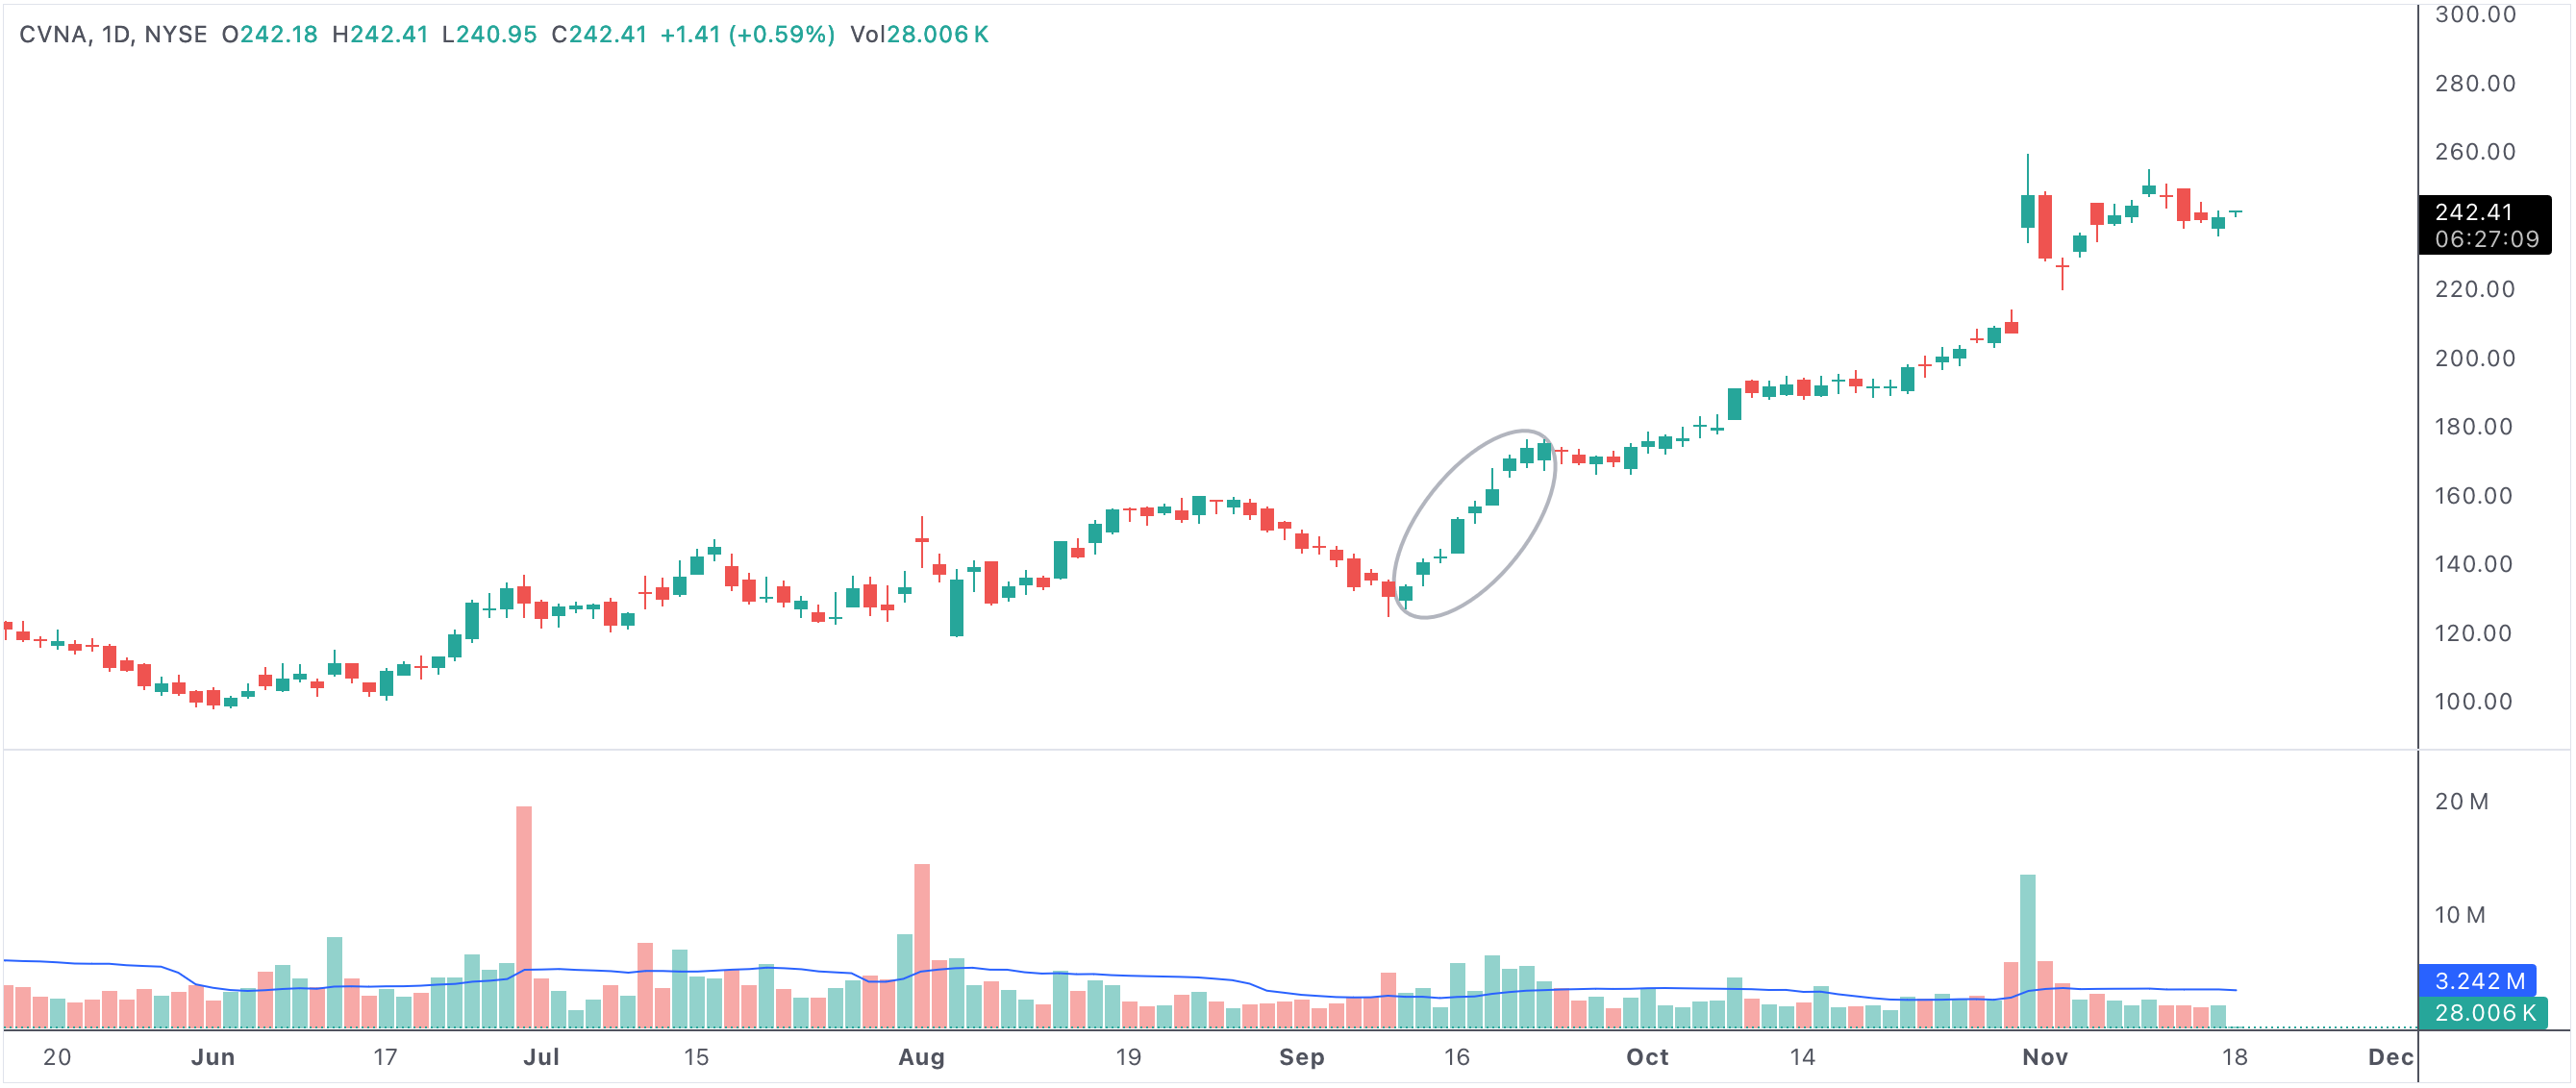
An example of a stock with the most consecutive up days
Stocks with the most consecutive up days
What Do Consecutive Up Days Signal?
Consecutive up days are often viewed as a powerful bullish signal, indicating consistent demand and persistent buying pressure. This pattern may be driven by strong earnings, favorable economic news, positive sentiment toward a sector, or technical breakouts above key resistance levels. When up days accumulate, the trend can become self-reinforcing—more traders notice the streak, and momentum investors may pile in, further pushing prices higher.
This environment is marked by increasing confidence, higher volumes, and a tendency for "fear of missing out" (FOMO) to fuel further gains. For short-term traders, the streak itself may be a signal to stay with the trend, while long-term investors may view it as a confirmation of broader positive fundamentals.
Risks of Overbought Markets and Reversal
While a stretch of consecutive up days is bullish on the surface, it can also indicate that markets are becoming overbought. Overbought conditions occur when prices rise too quickly without sufficient pauses or pullbacks, sometimes leading to valuations that outpace the underlying fundamentals. Technical indicators such as the Relative Strength Index (RSI) or stochastic oscillator can help identify when an asset is trading in overbought territory.
Extended rallies raise the risk of a bearish reversal or a sharp correction, particularly if buying begins to slow or if external factors shift sentiment. When too many investors become overly optimistic, any disappointing news can trigger profit-taking and rapid selloffs as traders rush to lock in gains. Thus, the very streak that signals strength can also be a warning that a reversal is near.
Psychology Behind Consecutive Up Days
The psychology of consecutive up days is fascinating. As markets climb day after day, even cautious traders may be drawn in, fearing they’ll miss further gains. Media coverage and social sentiment often amplify the trend, with headlines focusing on "record streaks" or "new highs." However, this optimism can be fragile. If prices get too far ahead of fundamentals, even minor negative surprises may be enough to spark a reversal.
Experienced investors keep a close eye on whether the rally is supported by rising volume, earnings growth, and solid economic data, or whether it is being fueled mainly by speculation and short-term trading.
- Sustained up days highlight strong market momentum and growing investor confidence.
- FOMO can drive more participants into the market, amplifying the rally.
- Extended streaks risk creating overbought conditions and price dislocations.
- Sharp corrections or reversals often follow when optimism becomes excessive or fundamentals disappoint.
- Technical indicators and trading volume are crucial for gauging the rally’s sustainability.
Strategies for Trading and Investing
For short-term traders, riding the wave of consecutive up days can be profitable, but discipline is needed to recognize when the momentum might end. Using trailing stops, monitoring for divergences in volume or technical indicators, and watching for reversal patterns like bearish engulfing candles or gaps down are all vital techniques. For investors, an extended rally can be a good time to review positions and consider whether to trim profits, especially if valuations seem stretched.
Conversely, those seeking entry points might wait for a natural pullback or consolidation period after a streak of up days, as overbought conditions often resolve with a temporary pause or mild correction before the broader uptrend resumes.
Conclusion: Opportunity and Caution
The longest consecutive up days showcase the strength and momentum of a bullish market. While these streaks offer exciting opportunities, they also demand caution—especially as risks of a reversal rise in overbought conditions. Successful traders and investors combine technical analysis, market psychology, and prudent risk management to capture gains while preparing for the possibility that every rally, no matter how powerful, eventually takes a breather.