Longest consecutive UT bot buy days - momentum, trend shifts, and signals
When a stock or index experiences the longest consecutive UT bot buy days, technical analysts and traders take notice. The UT bot, a momentum-based indicator, helps identify trend direction by generating buy and sell signals. An uninterrupted streak of buy days reflects strong upward momentum, with buyers dominating the market and confidence remaining high among participants. Understanding this pattern provides unique insights into both bullish trends and the risk of reversal if momentum weakens.
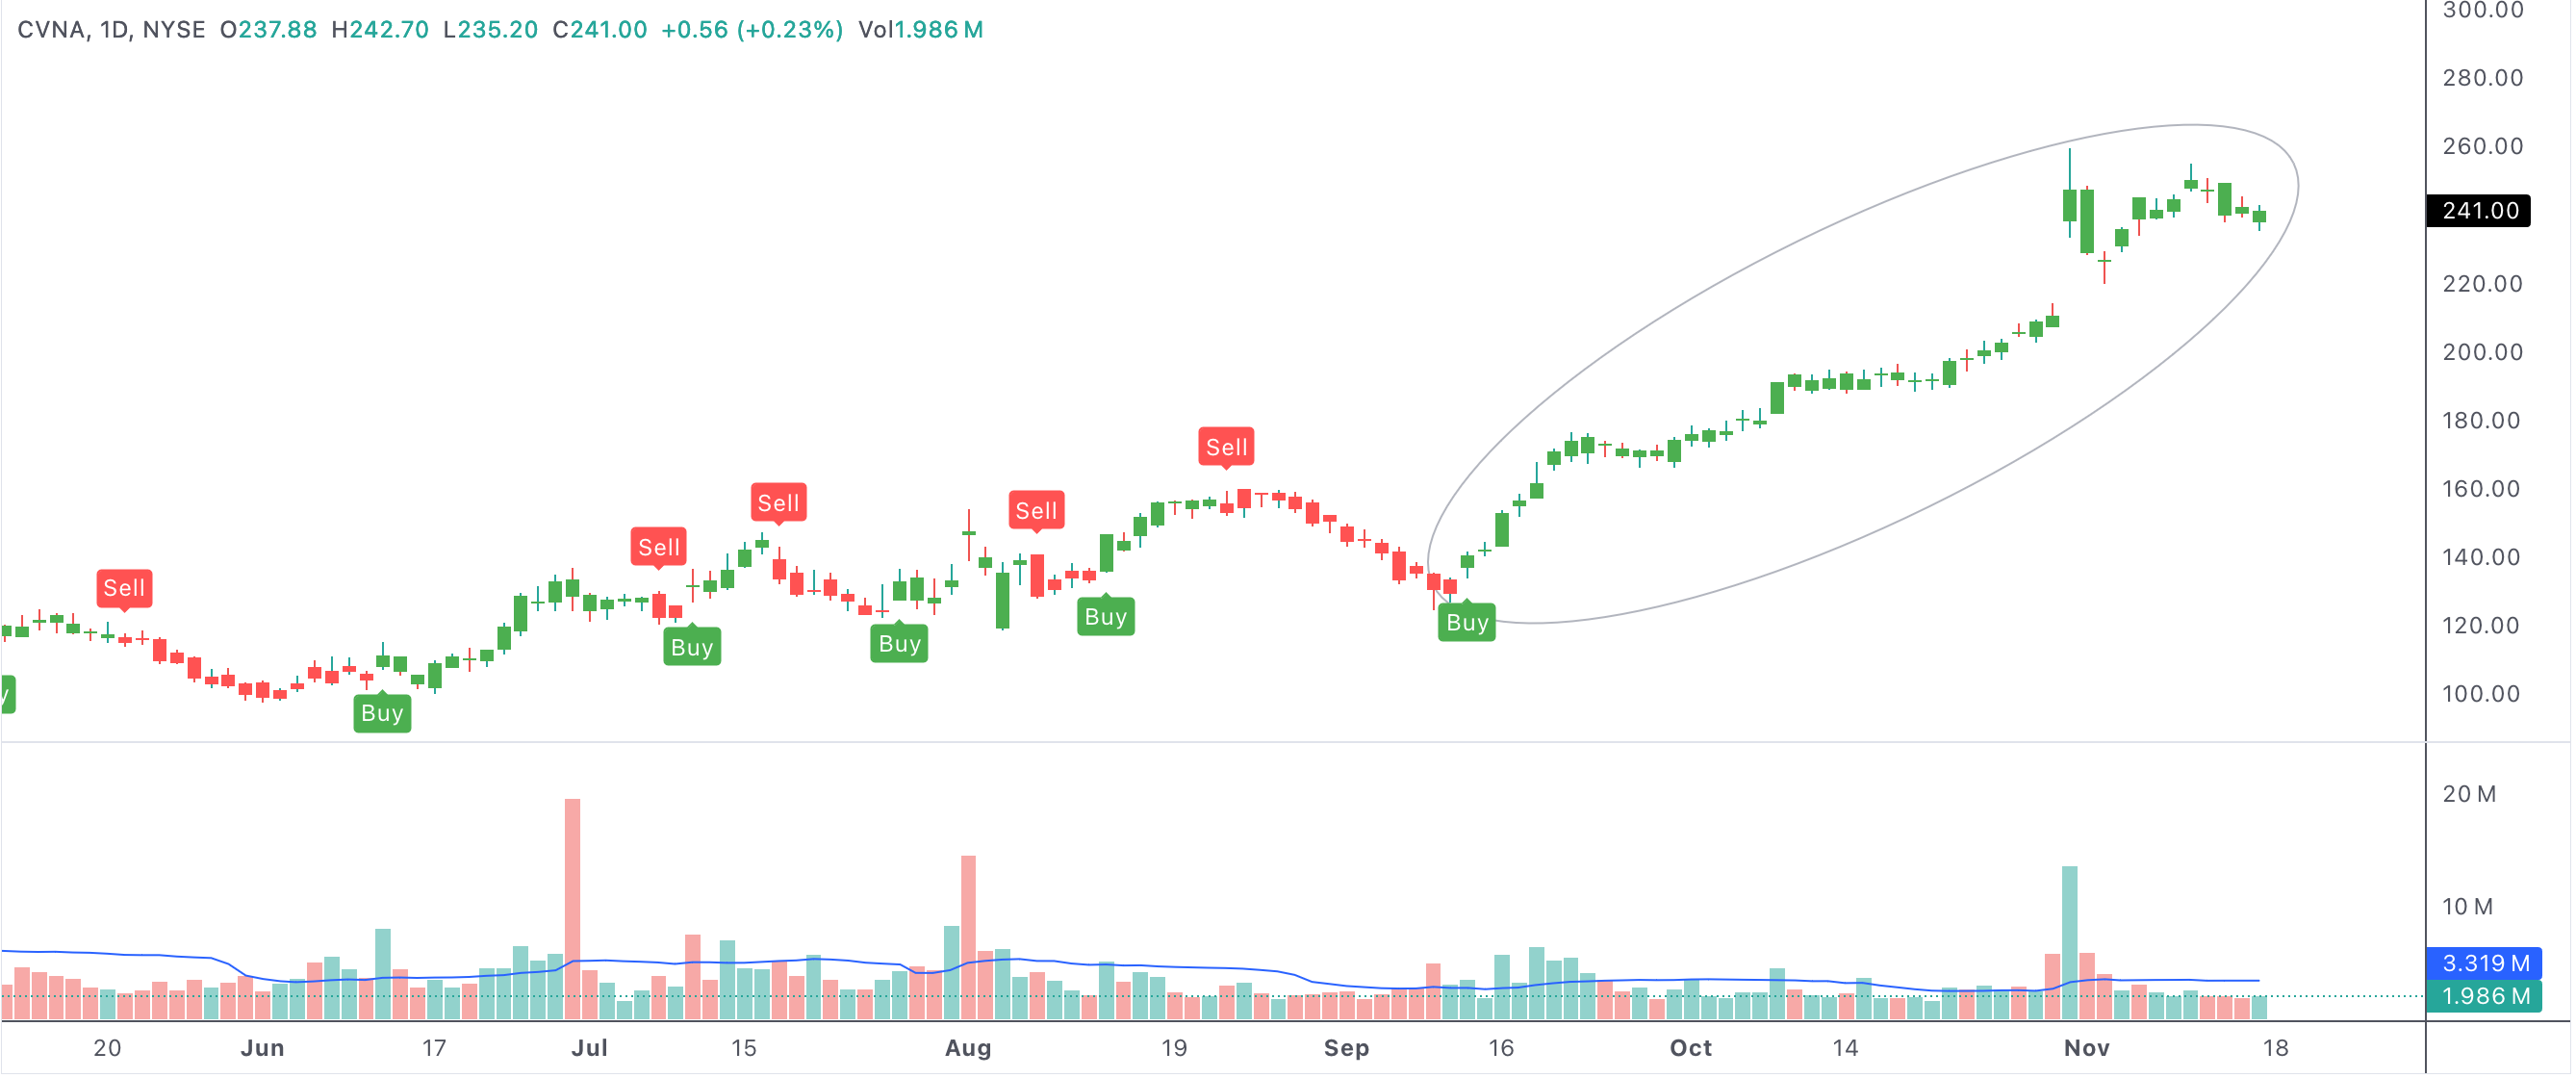
utbotupdays
An example of a stock with the longest consecutive UT bot buy days
Longest consecutive UT bot buy days
Understanding UT Bot Buy Days
The UT bot (Universal Trading Bot) is popular among traders for its ability to filter noise and highlight significant price movements. Each time a UT bot buy signal appears, it suggests renewed buying interest and the potential for further price appreciation. When these buy signals occur on consecutive days, it underscores persistent bullish sentiment and can serve as a confidence booster for those already in long positions.
Why Consecutive Buy Days Matter
The number of consecutive buy days can reveal much about underlying market strength. Long streaks of buy signals often occur during powerful uptrends or when a stock breaks out from consolidation. Traders may use this information to identify opportunities with strong momentum, as persistent UT bot buy days typically indicate that buyers are firmly in control.
However, it’s important to monitor for signs of exhaustion. If the streak of buy days suddenly ends or buy signals start to appear less frequently, it may hint at waning interest or a possible reversal. This transition is often subtle and can occur even as prices remain elevated.
Bullish and Bearish Implications
Generally, an extended run of UT bot buy days is considered a bullish signal. It suggests robust demand, often supported by positive news, strong earnings, or broader market optimism. Investors and traders are more willing to commit capital, driving prices higher and attracting even more attention as the streak continues.
Yet, no streak lasts forever. If market conditions change—perhaps due to macroeconomic events, earnings disappointments, or technical resistance—the streak of buy signals can abruptly end. This can mark a turning point where bullish conviction fades, leading to increased volatility or a trend reversal. Traders need to remain alert, as prolonged buying can sometimes precede overbought conditions and trigger profit-taking.
How to Use Long UT Bot Buy Streaks in Trading
For active traders, consecutive UT bot buy days can be a valuable entry or confirmation signal. Some will enter positions early in a streak, while others wait for a multi-day run to confirm the trend’s strength. It’s wise to combine UT bot signals with other indicators—such as support and resistance, volume analysis, or moving averages—to validate the setup and manage risk.
Exiting or tightening stops when the streak ends is a common risk management technique. If consecutive buy days suddenly drop off, or if a sell signal appears, traders may reduce exposure or prepare for a possible trend change.
Limitations and Risk Management
While UT bot buy streaks are useful for identifying momentum, they should never be used in isolation. Trends can change quickly, especially after a prolonged rally. False signals are always possible, particularly in choppy or range-bound markets. That’s why many traders combine UT bot buy days with broader market context and other technical analysis tools.
- Long streaks of UT bot buy days show strong bullish momentum and persistent buyer interest.
- A sudden decline or end to the streak can warn of exhaustion or an upcoming reversal.
- Combining UT bot signals with other indicators improves reliability and helps filter out noise.
- Always manage risk with stops and position sizing, as even strong trends can reverse rapidly.
- Monitor overall market sentiment and key news events for context around buy/sell signals.
Summary: Spotting Opportunities and Staying Vigilant
In summary, the longest consecutive UT bot buy days reveal much about a stock’s momentum and the psychology of market participants. While persistent buy signals can be a powerful bullish indicator, it’s essential to stay alert for changes in trend and to adjust your strategy accordingly. By combining UT bot analysis with sound risk management and market awareness, traders and investors can make smarter, more confident decisions—no matter how strong the trend appears.