Longest Consecutive UT Bot Sell Days and Signals for Bullish Reversal
Tracking the longest consecutive UT bot sell days can offer crucial insights for traders and investors alike. The UT bot is a popular trend-following indicator used in technical analysis to identify momentum shifts and potential buy or sell opportunities. When the UT bot issues multiple consecutive sell signals, it highlights sustained selling pressure in a stock or across the market. But while this can appear bearish on the surface, understanding the underlying dynamics may reveal the early signs of a bullish reversal.
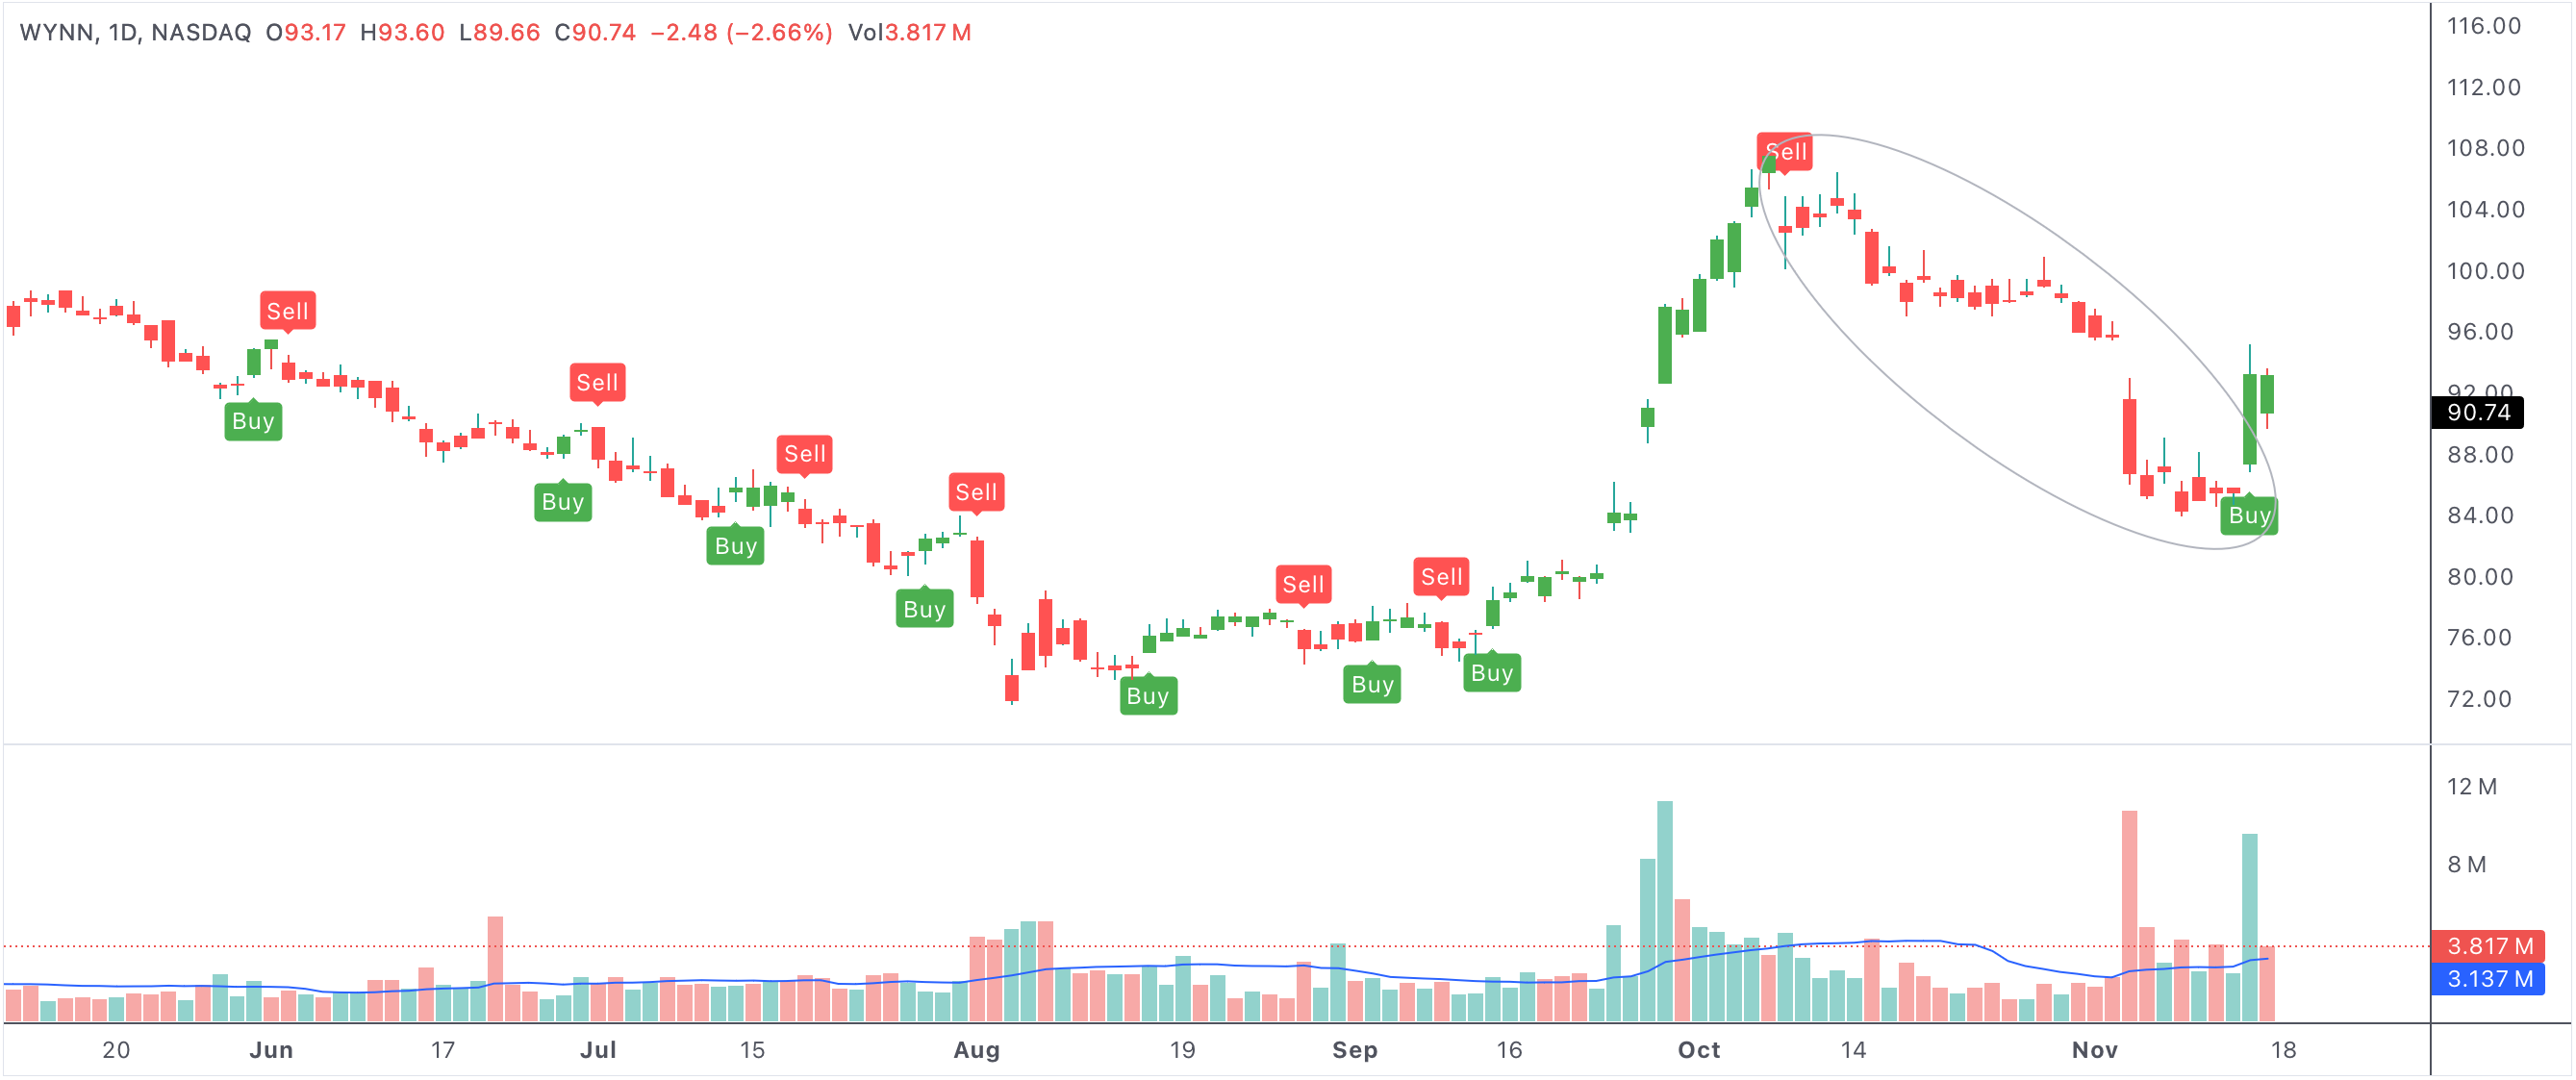
utbotdowndays
An example of a stock with the longest consecutive UT bot sell days
Longest consecutive UT bot sell days
What Do Consecutive UT Bot Sell Days Mean?
Consecutive UT bot sell days occur when the UT bot continually triggers sell signals for several sessions in a row. This typically means that sellers are firmly in control, and the price is struggling to find support. Such a sequence can reflect negative sentiment, persistent momentum decline, or even fundamental concerns weighing on the stock.
However, the longer a sell streak lasts, the more it can lead to oversold conditions. Just as markets can become overbought in long rallies, a prolonged string of sell days may exhaust the available supply and leave the door open for a change in direction, especially if buyers begin to perceive value.
From Bearish to Bullish: The Setup for Reversal
While a long stretch of UT bot sell signals confirms strong bearish momentum, savvy traders watch these periods closely for signs of exhaustion. As selling persists, the pool of motivated sellers shrinks, and prices may reach levels that attract interest from bargain hunters, institutional investors, or those looking for a mean-reversion trade.
The transition from heavy selling to accumulation can happen quickly. Once value buyers start stepping in and the sell signals diminish, prices often stabilize or bounce. If this is accompanied by positive volume or new bullish technical signals, a reversal rally may follow.
Why Do These Sell Streaks Matter?
Longest consecutive UT bot sell days are significant for several reasons:
- They indicate persistent negative momentum and bearish sentiment, warning of continued downside.
- Extended sell periods can push a stock into oversold territory, creating potential value for reversal buyers.
- If selling pressure suddenly dries up, it may trigger a sharp reversal as short-covering and new buyers enter.
- These streaks often precede key inflection points in price trends, making them a focus for swing traders and technical analysts.
Identifying Accumulation and Buyer Interest
Not all prolonged sell periods result in immediate reversals, but tracking volume and price action can help identify when the tide is turning. Look for decreasing volatility, flattening price action, or subtle increases in buying volume. When the UT bot stops generating sell signals or flips to a buy, it can mark the start of a new uptrend.
Accumulation phases often occur at the end of extended declines, as smart money positions for a move higher. Technical confirmation may include bullish candlestick patterns, support holding, or bullish divergences in other indicators.
Summary: Key Takeaways for Traders
In summary, the longest consecutive UT bot sell days highlight periods of intense selling, often driven by negative sentiment or momentum. But these very conditions can lay the groundwork for a bullish reversal if selling is exhausted and buyers become attracted by lower prices. Recognizing the signs of exhaustion, accumulation, and the shift in technical signals is essential for capitalizing on potential market turnarounds.
- Persistent UT bot sell days reflect ongoing bearish sentiment and momentum.
- Oversold conditions may attract value buyers, leading to accumulation.
- A sudden drop in selling and the return of buyers can trigger a reversal rally.
- Tracking these patterns helps traders prepare for shifts in sentiment and market direction.
By understanding both the risks and opportunities that come with prolonged UT bot sell streaks, traders and investors can better position themselves for the next major move—whether it’s further downside or an impending bullish reversal.