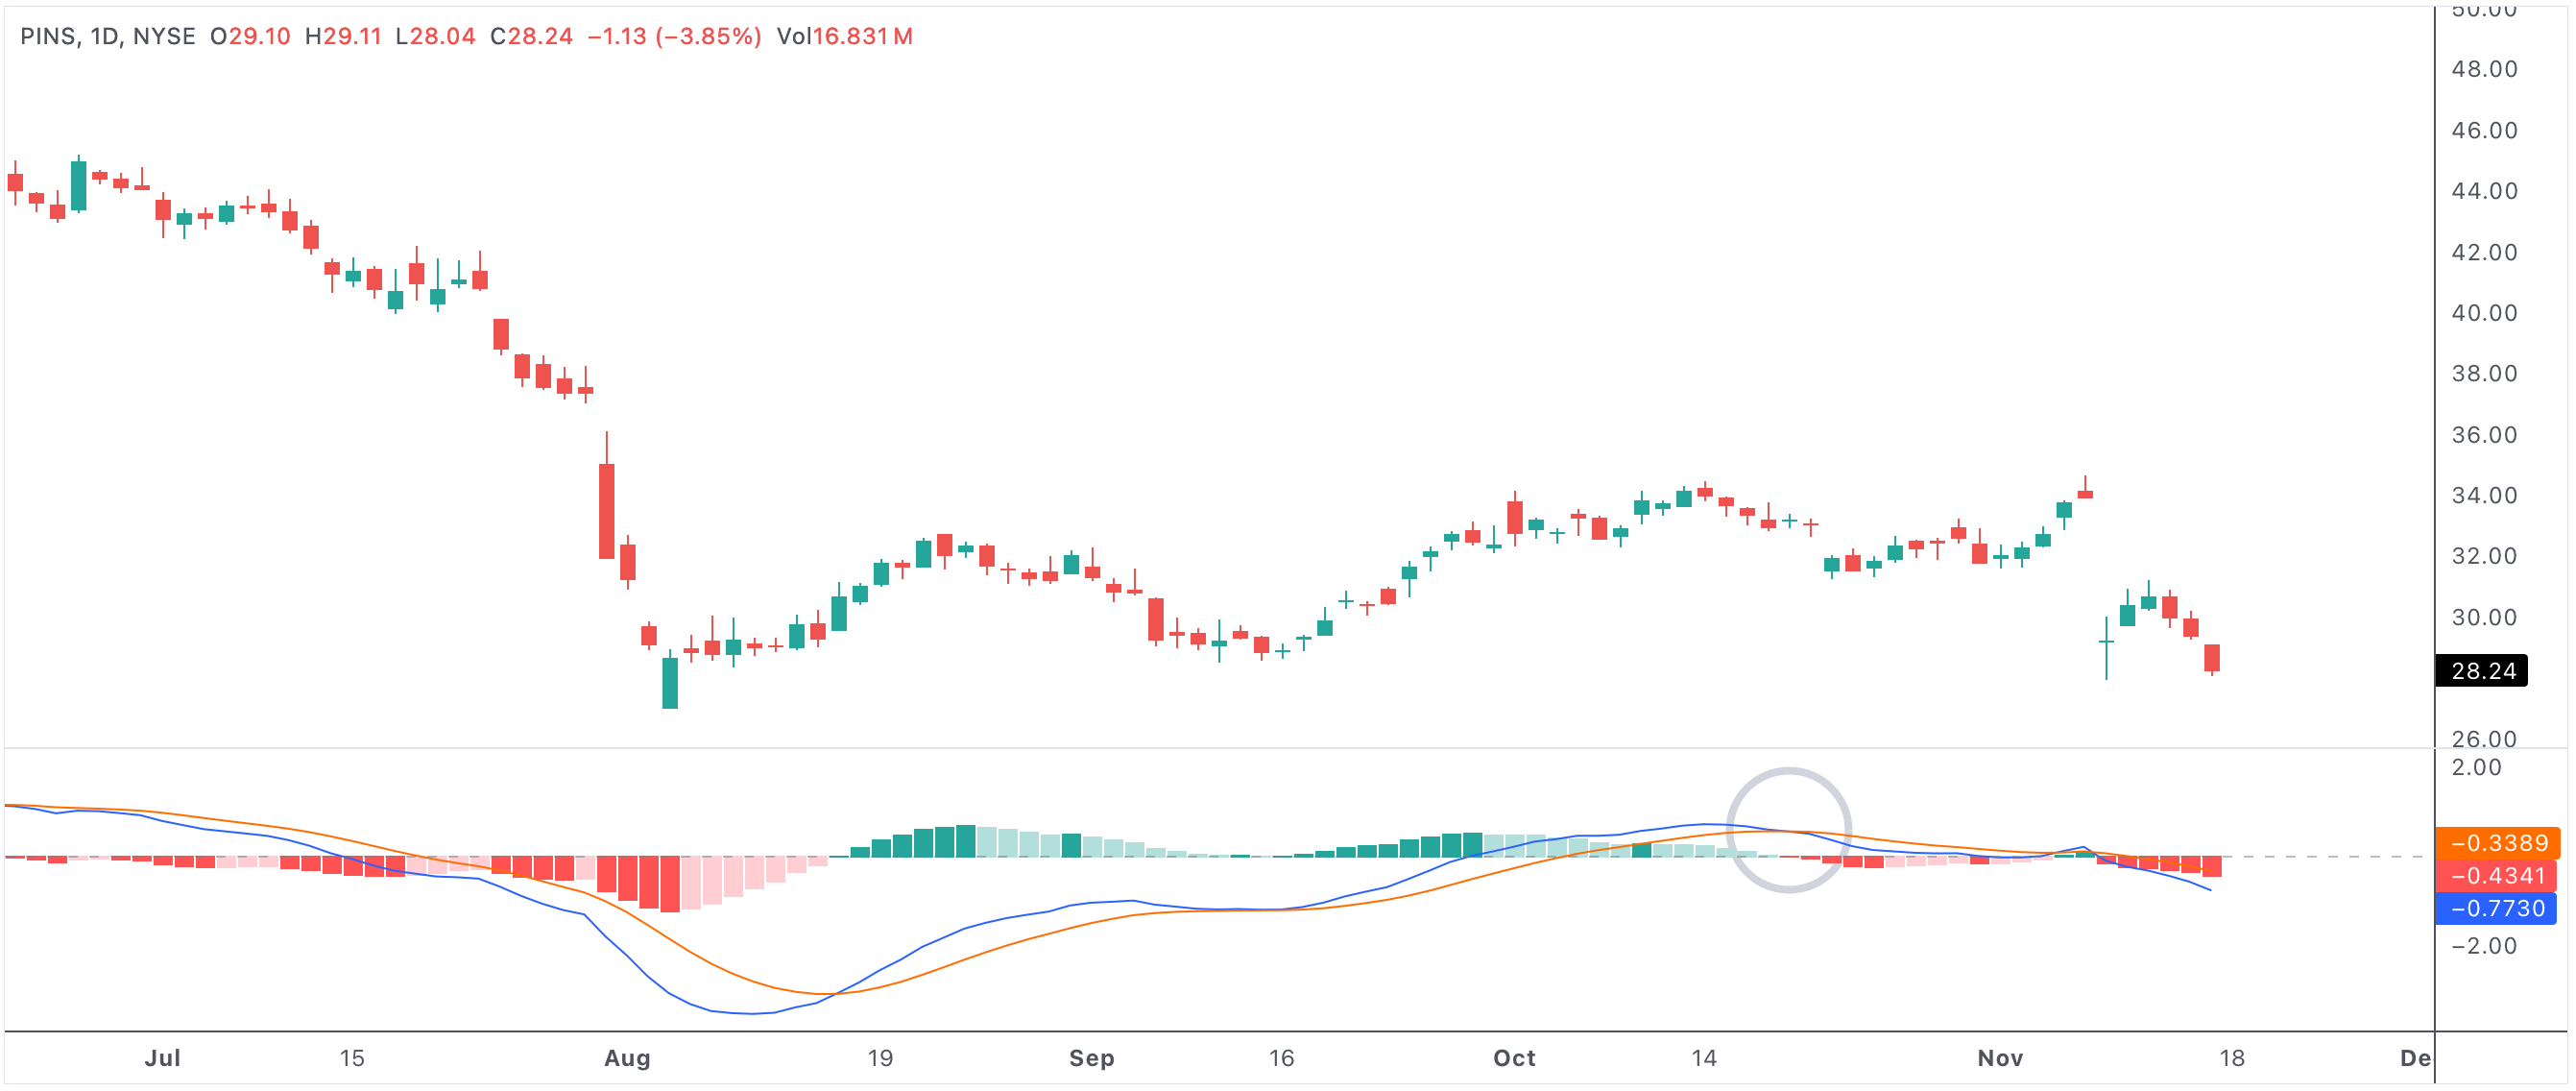
MACD bearish cross after record streak above signals momentum reversal risk
The MACD bearish cross after the longest consecutive days above is a powerful technical signal for traders and investors watching for trend reversals. This pattern arises when a stock or index has maintained a sustained uptrend, with the MACD line consistently above its signal line, only to experience a bearish crossover—where the MACD line dips below the signal line—immediately following a record streak of strength.

macdbearcross
An example of a MACD bearish cross after the longest consecutive days above key levels.
MACD bearish cross after record streak above
Understanding the MACD Bearish Crossover
The Moving Average Convergence Divergence (MACD) indicator is a staple of technical analysis. It reflects the relationship between two moving averages—typically the 12-period and 26-period EMAs. When the MACD line falls below the signal line, it’s called a bearish crossover and often points to a momentum shift from bullish to bearish. This is especially significant after an extended uptrend, as it could suggest the prevailing buying momentum is running out of steam.
Why a Record Streak Amplifies the Signal
When a stock enjoys the longest stretch of days with the MACD bullish (above the signal line), it indicates persistent buying strength and positive sentiment. The first bearish cross after such a streak can feel like a wake-up call for market participants. It highlights the first technical warning that the trend may be stalling or reversing, especially if the crossover is confirmed by high trading volume or other indicators turning negative.
Bearish Implications for Stocks and Markets
A MACD bearish cross after a record uptrend can act as a catalyst for profit-taking and risk reduction. Many technical traders see this as an early sign of a potential trend reversal or at least a deeper pullback. If the broader market environment is also weakening, or if other indicators—like RSI or price action—show divergence or loss of momentum, the bearish cross gains even more significance.
- Momentum reversal: The cross signals a shift from bullish to bearish momentum after a long uptrend.
- Profit-taking trigger: Investors and traders may sell to lock in gains, increasing selling pressure.
- Risk of deeper correction: If confirmed by other bearish signals, a larger pullback may unfold.
- Institutional caution: Large funds may rotate out of positions, increasing downside risk.
- Confirmation is key: Volume spikes or price breaking below support can validate the bearish signal.
Not Always the End: False Signals and Context
It’s important to remember that not every MACD bearish cross leads to a prolonged downtrend. Sometimes, it simply marks a healthy pause or a brief consolidation before the trend resumes. This is why experienced traders combine the MACD signal with other tools—such as price support levels, volume analysis, and broader market sentiment—before making trading decisions.
How to Trade or Manage Risk with This Signal
For active traders, a MACD bearish crossover after an extended uptrend can serve as an exit signal or a trigger to tighten stop losses. Aggressive traders might even look for short opportunities if further technical breakdowns occur. For long-term investors, it’s often a signal to review risk exposure and watch for confirmation before making major portfolio changes.
Combining With Other Technical Analysis Tools
The effectiveness of the MACD bearish cross is strengthened when paired with other signals. Watch for negative divergences in RSI, failure to reclaim key moving averages, or breaks below support levels. High trading volume on the crossover day adds further conviction to the signal, while a quick rebound can suggest the market isn’t ready to reverse just yet.
Summary: Early Warning or Healthy Pullback?
The MACD bearish cross after the longest consecutive days above acts as a technical warning of possible momentum loss, trend reversal, or market correction. While it can precede major declines, it may also simply flag a healthy pause in a strong market. Context, confirmation, and sound risk management are essential to interpreting and trading this important technical signal.