MACD Bullish Cross After Longest Downtrend - Signal for Momentum Shift
The MACD bullish cross is a classic technical analysis signal that attracts attention from active traders, swing traders, and investors who follow momentum indicators. When this bullish cross occurs after the longest consecutive days below the MACD signal line or baseline, it can provide even greater significance, often marking a transition from prolonged weakness to potential strength. Let’s explore why this pattern matters, how it’s interpreted, and how traders use it to spot new bullish opportunities in the stock market.
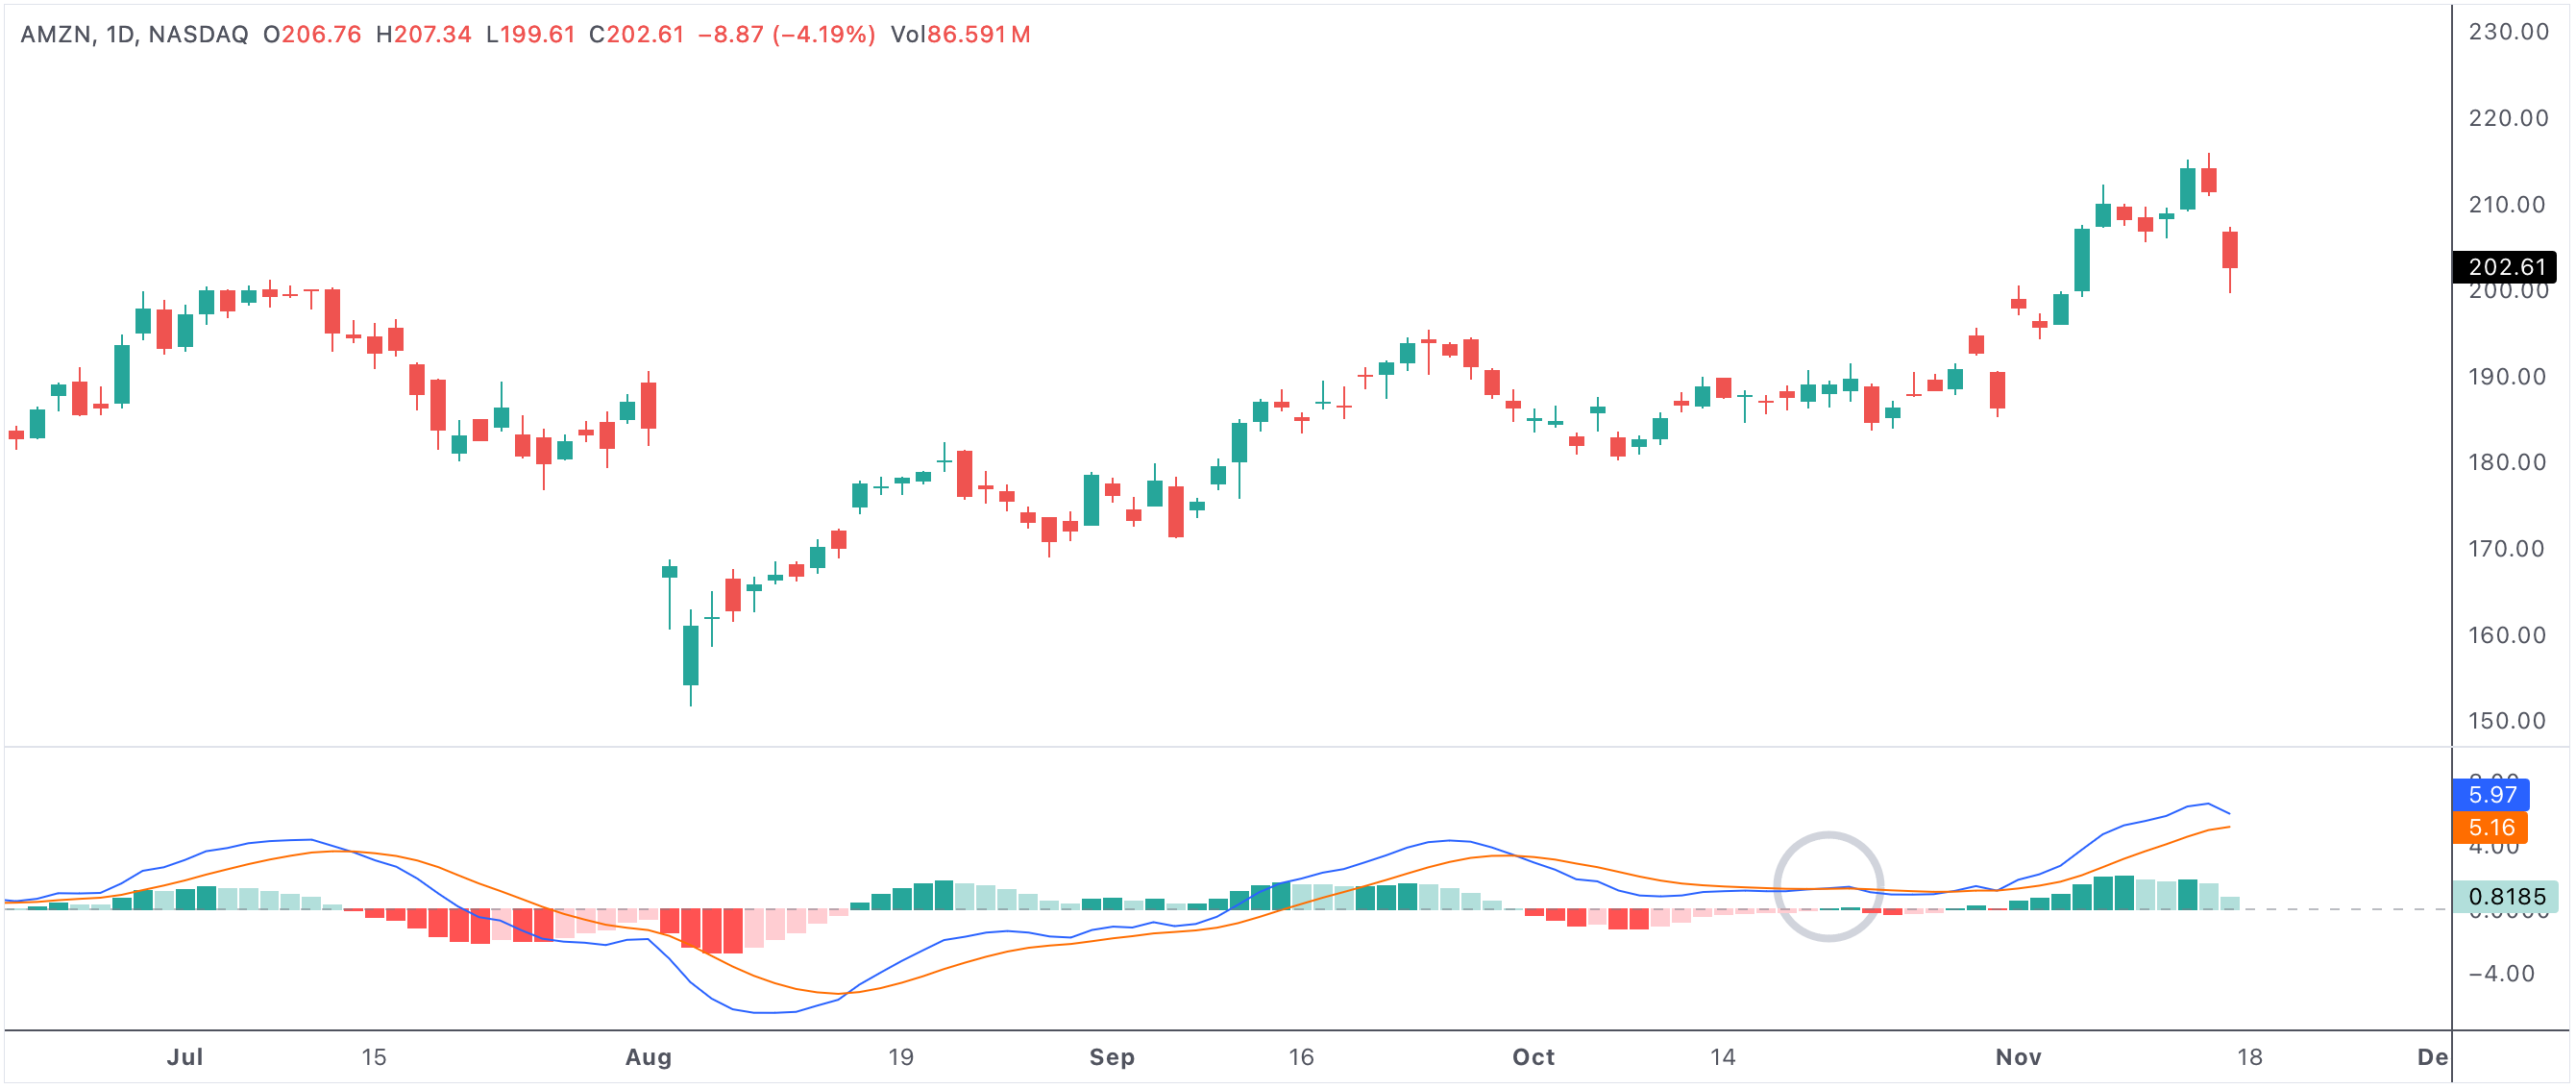
macdbullishcross
Example: Stock with a MACD bullish cross after a record streak below the signal line.
MACD bullish cross after longest consecutive days below
What Is a MACD Bullish Cross?
The Moving Average Convergence Divergence (MACD) indicator is a powerful tool for identifying momentum changes. A bullish cross occurs when the MACD line rises above the signal line, signaling that bullish momentum is building. When this cross happens after a long period of the MACD line being below the signal line, it often marks the end of selling pressure and a fresh wave of buying interest.
Why Consecutive Down Days Matter
The longer a stock remains below its MACD signal line, the more it signals ongoing bearish sentiment and persistent downward momentum. After the longest stretch of consecutive down days, stocks may become deeply oversold, and sellers can become exhausted. This is when the odds of a reversal often increase. A MACD bullish cross at this moment is considered more reliable because it represents not just a blip but a fundamental shift in momentum.
Bullish Implications and What to Watch For
When a MACD bullish cross follows a significant downtrend:
- Momentum Shift: Indicates that buying pressure is finally overcoming selling pressure.
- Selling Exhaustion: Prolonged weakness can mean sellers are tapped out, creating room for a rally.
- Technical Confirmation: Many traders use this cross as a buy signal, especially if volume spikes and price action confirms the shift.
- Oversold Reversal: After extended declines, the probability of a strong bounce or full trend reversal rises.
- Market Recovery: If the broader market or sector is improving, this signal is even more compelling.
How Traders and Investors Use the Signal
Savvy traders set screeners and alerts for MACD crosses after unusually long periods of bearish momentum. Here’s how this setup is often used:
- Enter a position when the bullish cross is confirmed by a price breakout or increased trading volume.
- Combine the signal with other technical indicators like RSI, moving averages, or candlestick patterns for stronger conviction.
- Set stop-loss orders below recent lows to manage risk in case the reversal fails.
- Watch for confirmation in related stocks or market indices for added confidence in the trend reversal.
Longer streaks below the MACD line may signal that a bigger rebound is possible, especially if the reversal is supported by positive news, earnings, or improving fundamentals.
Typical Trade Scenarios and Expectations
After a bullish MACD cross, especially one that follows a record-long period below, stocks often experience an initial surge as short sellers cover and new buyers enter. This can result in:
- Sharp Rally: Sudden price increases as momentum shifts and sentiment turns positive.
- Sustained Trend: The rally may persist if broader market conditions improve or the stock enters a new uptrend.
- False Starts: Not every MACD cross leads to a full reversal; always combine with other technical/fundamental evidence.
Whether you are a day trader, swing trader, or long-term investor, the MACD bullish cross after the longest stretch below can be a high-probability setup worth watching. It is a textbook example of how technical analysis can help identify changes in market character and reveal new buying opportunities.
Summary: MACD Bullish Cross as a Bullish Opportunity
To sum up, the MACD bullish cross after a prolonged downtrend serves as a signal of momentum shift, selling exhaustion, and possible market recovery. By combining this signal with volume, price action, and broader context, traders can increase their odds of catching new bullish trends at their earliest stages.