MACD cross below zero after longest run above - momentum shift or warning?
The MACD, or Moving Average Convergence Divergence, is a core technical indicator used by traders to measure momentum and trend direction. When the MACD crosses below zero after the longest stretch of consecutive days above the zero line, it serves as a potentially significant inflection point in market sentiment and often triggers a fresh round of technical analysis.
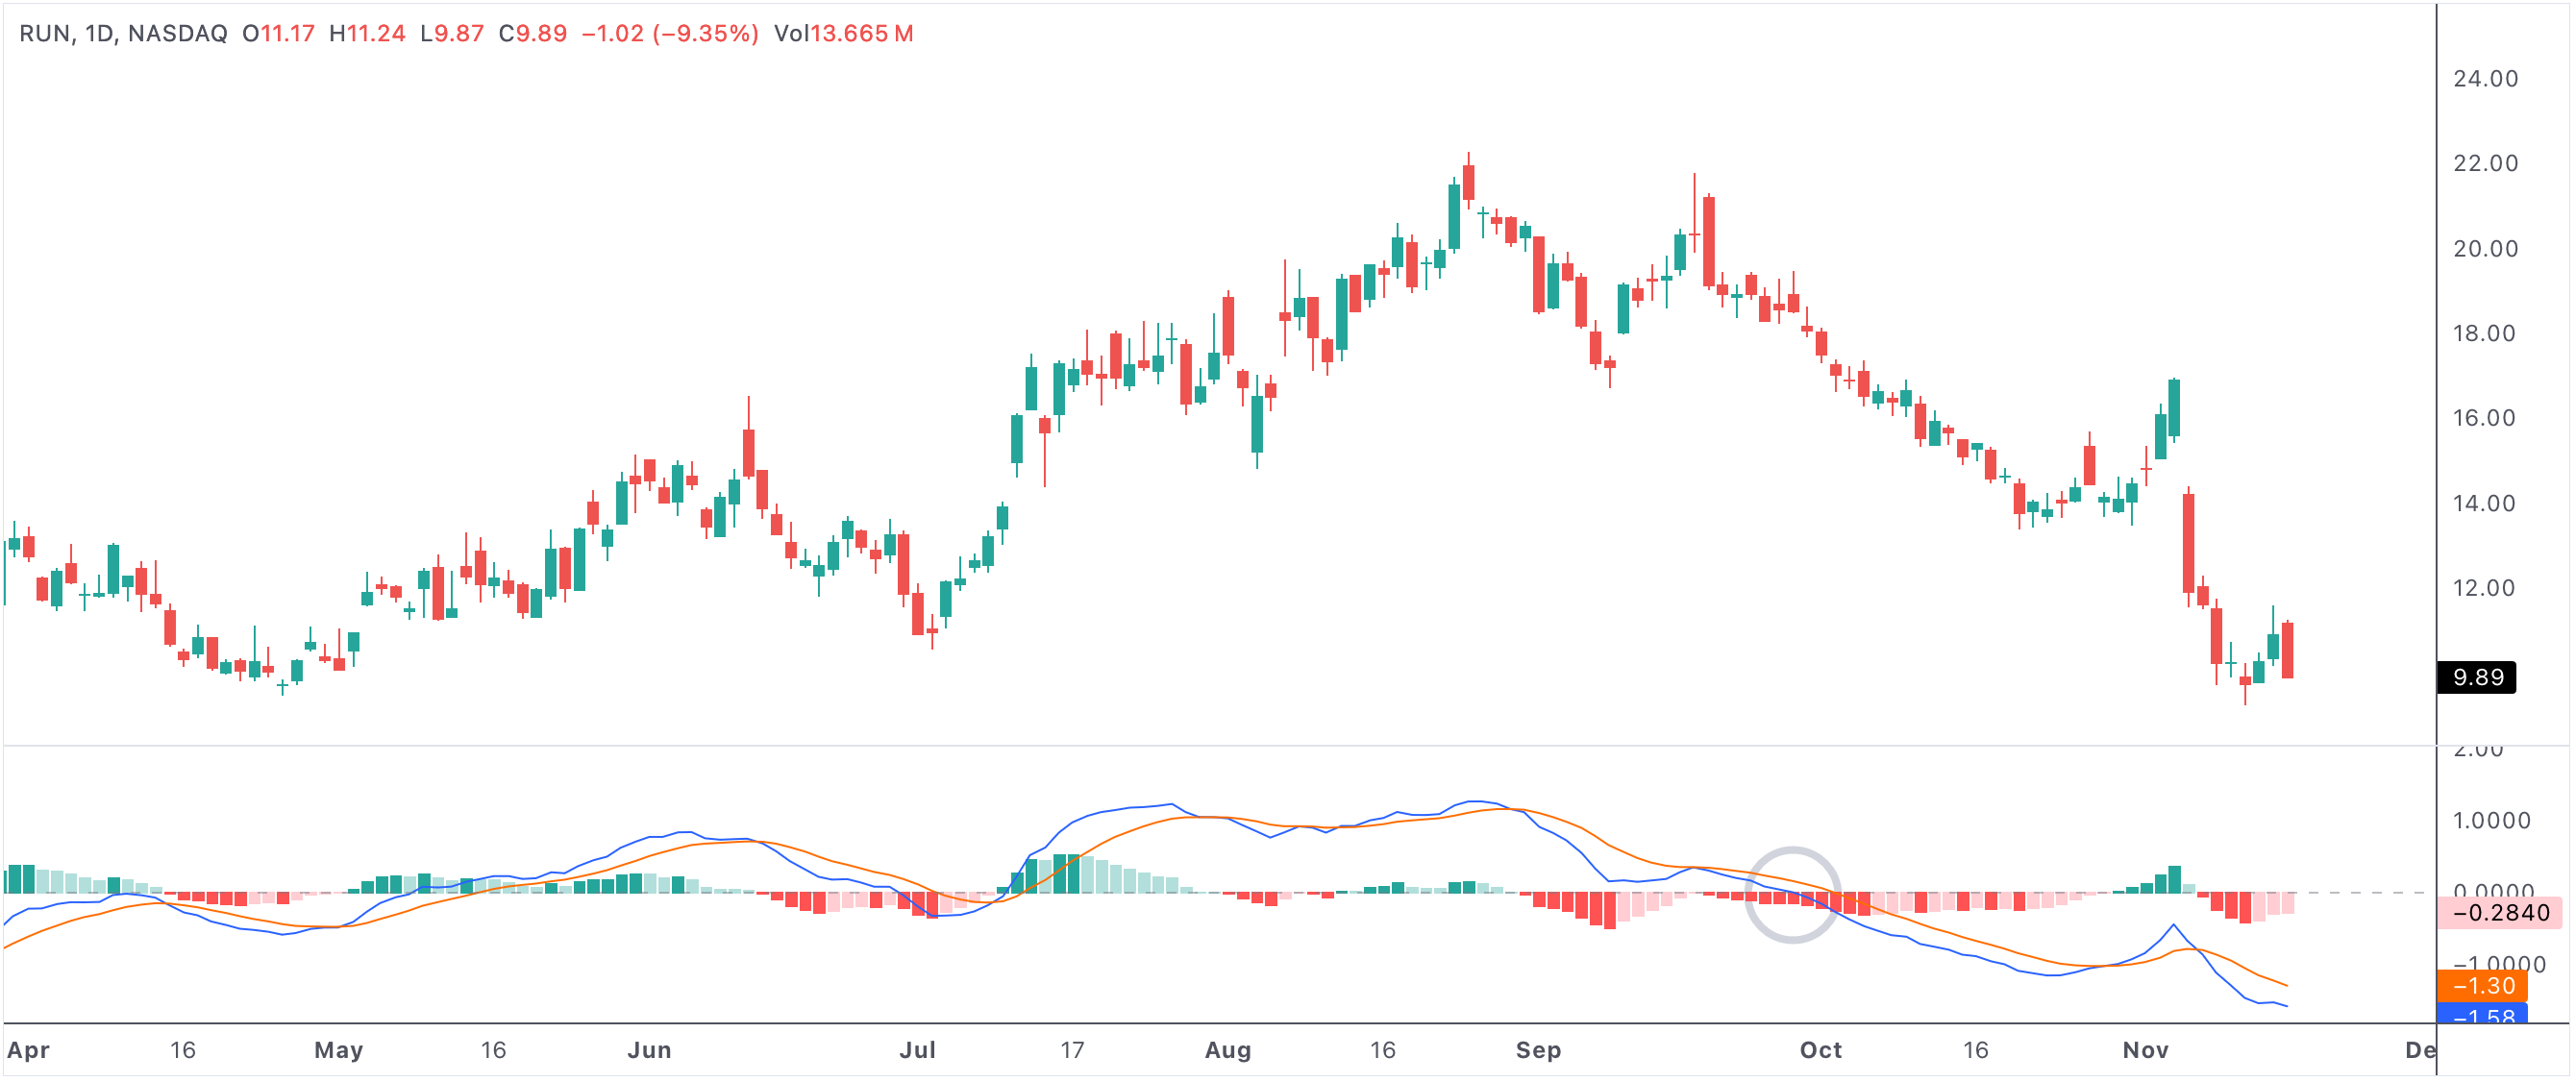
macdcrossbelow0
An example of a stock with the MACD crossing below 0 after a long positive streak
MACD cross below 0 after longest consecutive days above
How the MACD Zero Line Works
The MACD is calculated by subtracting a longer-term exponential moving average (EMA) from a shorter-term EMA, with the zero line representing the precise point at which upward and downward momentum are in balance. As long as the MACD stays above zero, it generally reflects bullish momentum. When it falls below zero, it is interpreted as bearish momentum gaining control.
Significance of the Longest Positive Streak
A prolonged period of the MACD above zero is often a hallmark of a robust uptrend or bullish market condition. This extended bullish streak suggests sustained buying, broad market optimism, and strong upward momentum. When the indicator finally drops below zero after such a run, it does not go unnoticed. The longer the streak, the more meaningful the signal, as it could indicate that the underlying asset or market is losing steam and may be ready for a change in trend.
What Does the MACD Cross Below Zero Mean?
The MACD crossing below zero acts as a wake-up call for traders and investors. It is often seen as a bearish signal and a potential warning of a coming correction or trend reversal. This move can reflect fading bullish momentum, exhaustion among buyers, or an early shift in market sentiment. Technical traders use this moment as an opportunity to reassess their positions, tighten stops, or even look for short setups, especially if other bearish technical indicators confirm the signal.
However, context is everything. Not every cross below zero results in a major selloff. Sometimes, the move merely signals a brief pause or minor correction within a larger uptrend, particularly if the broader market environment remains favorable.
Common Follow-Through Scenarios
There are several scenarios that can follow a MACD cross below zero:
- Trend reversal: If accompanied by other bearish signals and negative price action, a full-fledged trend reversal may follow, with lower highs and lower lows on the chart.
- Short-term correction: If the macro picture or fundamentals remain bullish, the cross below zero may only result in a pullback before the uptrend resumes.
- False signals: In choppy, range-bound markets, MACD zero crosses can sometimes produce whipsaws, so traders often look for confirmation from price patterns, volume, or additional indicators.
How Traders Use the Signal
Many technical traders monitor the MACD zero cross as a risk management tool. When this signal occurs after an extended bullish period, it may prompt them to exit long positions, hedge portfolios, or consider bearish trades. Others wait for additional confirmation, such as a breakdown in price support, bearish candlestick patterns, or a negative divergence with price before acting on the MACD signal.
Some strategies involve re-entering long trades if the MACD quickly recovers and crosses back above zero, viewing the move as a healthy reset rather than the end of a bullish cycle.
Summary: Navigating Momentum Shifts
The MACD cross below zero after the longest consecutive days above is a technical signal worth watching, but it is not a guarantee of an immediate downtrend. Instead, it should be treated as a caution flag—an invitation to analyze broader context, price action, volume, and other indicators. In the hands of a disciplined trader, this signal becomes a valuable part of a comprehensive strategy, helping manage risk and identify potential inflection points in market momentum.