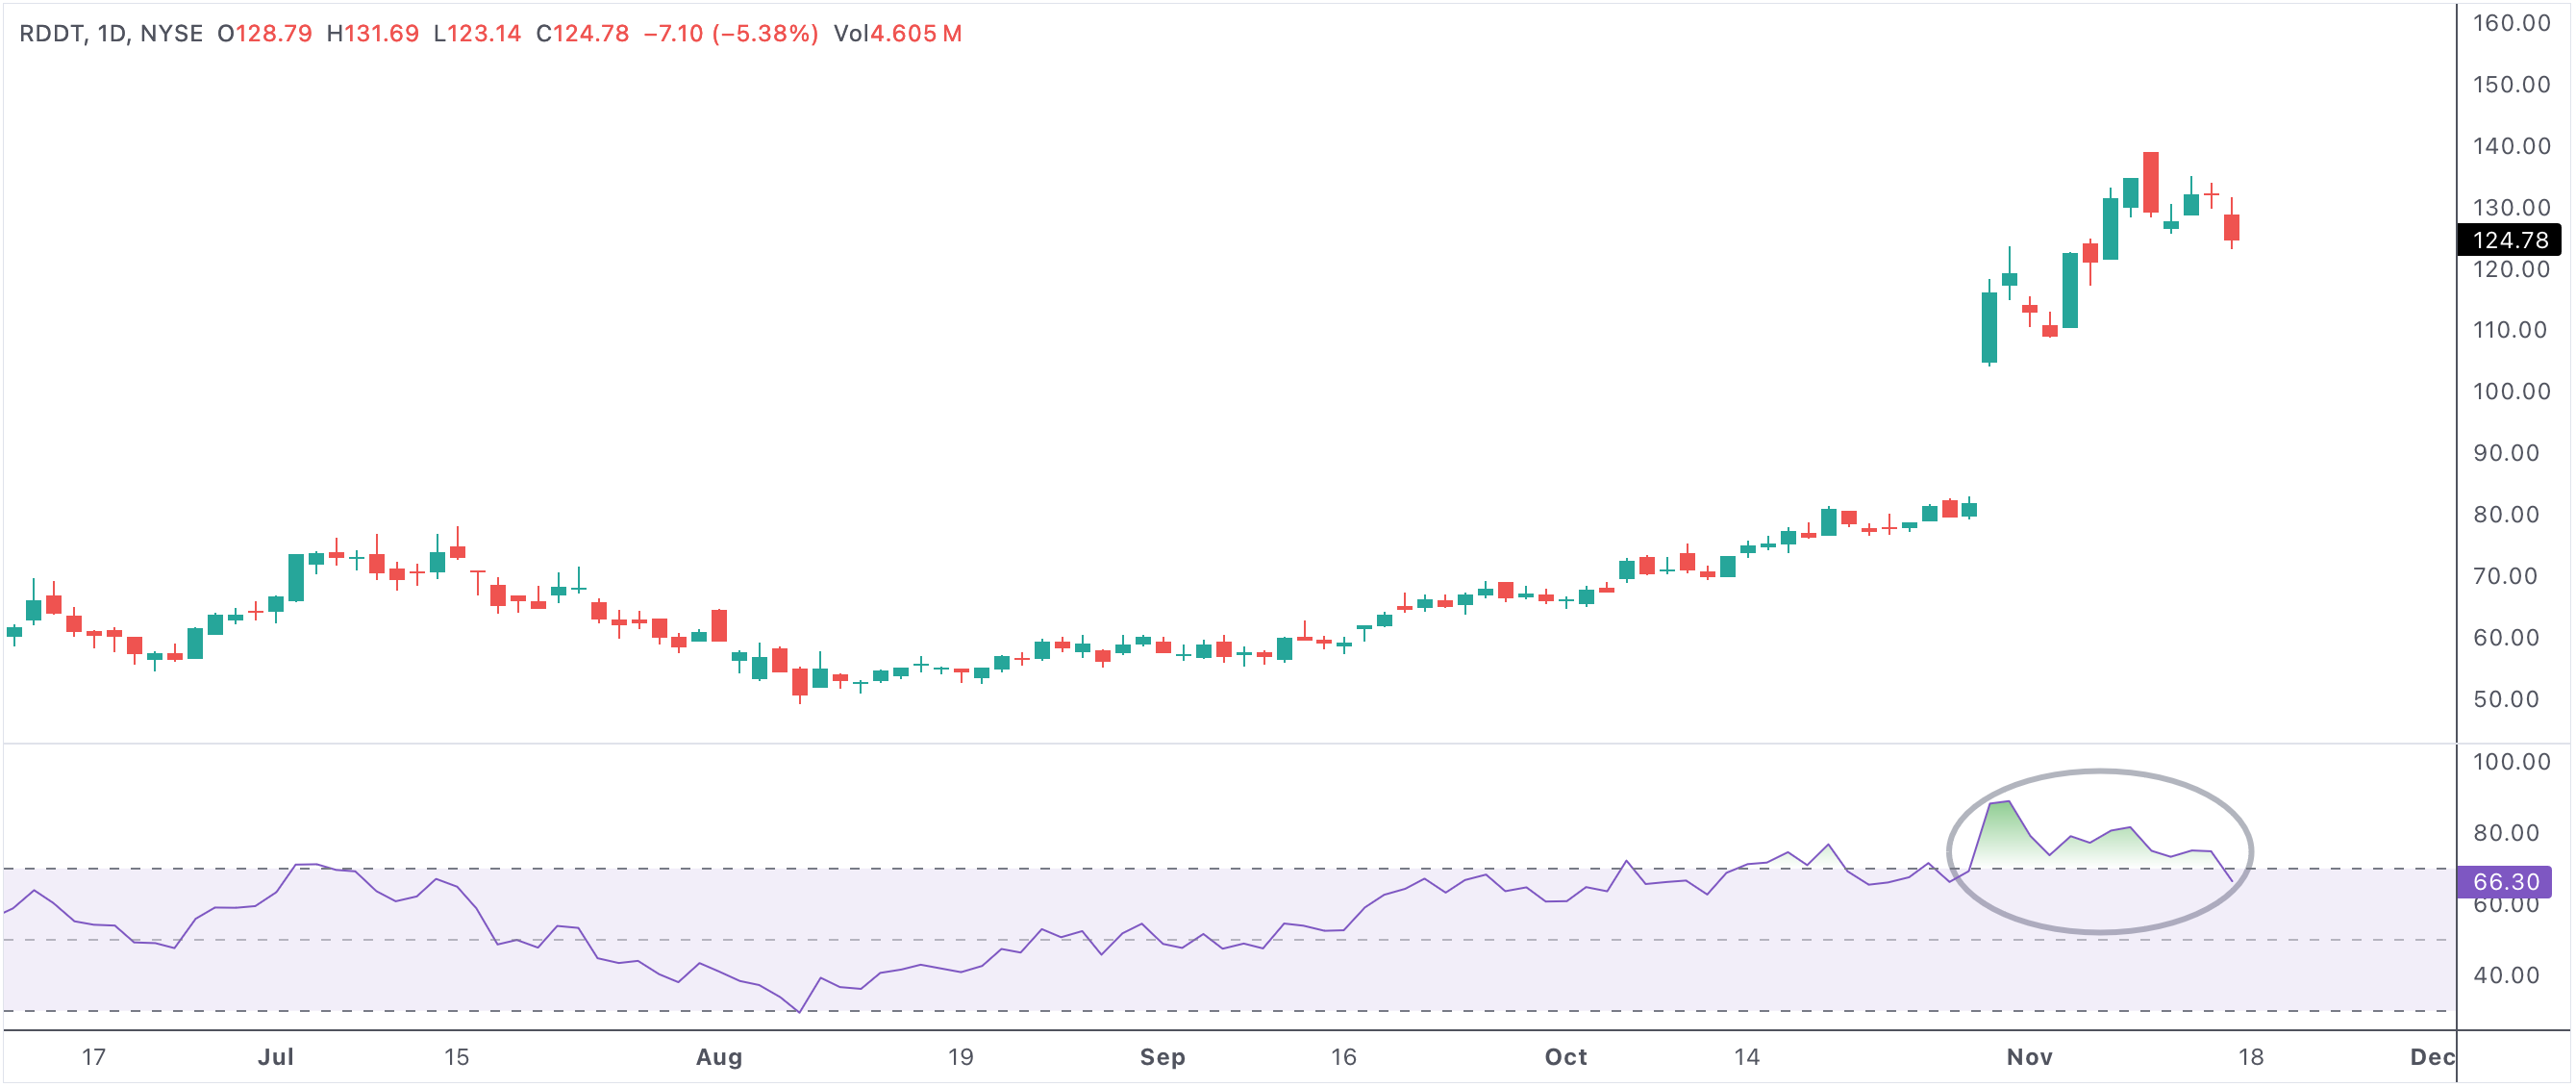
Most consecutive days with RSI above 70 - signals, momentum, and risk
When a stock or market index experiences the most consecutive days with its Relative Strength Index (RSI) above 70, this streak draws the interest of both traders and analysts. The RSI is a popular momentum oscillator that ranges from 0 to 100 and measures the speed and change of price movements. Readings above 70 are commonly interpreted as an “overbought” condition, suggesting the asset may be due for a pullback or price correction.
rsioverbought
An example of a stock with the most consecutive days with RSI above 70
Most consecutive days with RSI above 70
Understanding the RSI and Overbought Conditions
The RSI is designed to identify overbought or oversold conditions in the market, providing valuable trading signals. When the RSI rises above 70 for several days in a row, it reflects extremely strong buying momentum. This is usually associated with a bullish trend, as investors and traders continue to push prices higher. However, while a high RSI streak can seem positive, it often comes with increasing risk, as prices can become unsustainably elevated.
Bullish Momentum and Trader Psychology
Prolonged periods with RSI above 70 can occur during strong market rallies or when a particular stock is driven higher by positive news, earnings, or sector momentum. During these times, bullish sentiment often builds on itself as more traders jump in, fearing they might miss out on further gains. This momentum trading can cause prices to become “overextended,” meaning they’ve risen too quickly in too short a time relative to historical norms.
Sometimes, such conditions can persist for longer than expected, especially in powerful uptrends. However, the longer an asset stays overbought, the more likely traders and investors are to take profits, which can spark a reversal or at least a short-term correction.
Reversal Risk and Technical Analysis
A key reason analysts track the most consecutive days with RSI above 70 is that it often precedes a change in trend. Technical traders use this as a warning signal—when nearly all the buyers are already committed, there may be few new entrants to drive prices even higher. At the same time, existing holders may see the overbought readings as a reason to lock in profits, increasing selling pressure and the risk of a bearish reversal.
It’s also common for institutional investors to use high RSI streaks as an exit or hedge signal, particularly if the rally was driven by speculative enthusiasm rather than improving fundamentals.
How to Use RSI Streaks in Your Strategy
Most traders do not rely on RSI alone but use it as part of a broader technical analysis toolkit. When an asset hits multiple days with RSI above 70, look for confirmation with price action, volume, and other indicators such as moving averages or candlestick patterns. This can help determine whether a correction is likely or if momentum is still strong enough to warrant staying in the trade.
- Persistent RSI above 70 shows strong momentum, but caution is needed as reversal risk grows.
- Volume spikes, bearish candlesticks, or divergence with other indicators can confirm a possible correction.
- Some traders will tighten stops or scale out of positions as the overbought streak extends.
- Profit taking often accelerates once the first signs of weakness appear, leading to sharp, fast pullbacks.
- Longer streaks of high RSI are rarer and may indicate exceptionally strong investor sentiment or market euphoria.
Summary: Managing Risk and Reward
The most consecutive days with RSI above 70 is a rare but significant technical signal. It represents a period of intense bullish momentum, but also serves as an early warning that markets or stocks may soon become vulnerable to a correction. Understanding the balance between strong momentum and reversal risk is crucial for traders and investors aiming to maximize gains while protecting capital. Always use multiple indicators and sound risk management when making trading decisions based on RSI and other technical signals.