Most Consecutive Days With RSI Under 30 - Oversold Stock Opportunities
Identifying stocks with the most consecutive days with RSI under 30 is a classic approach to uncovering deeply oversold opportunities in the market. The Relative Strength Index (RSI) is a widely used momentum oscillator, and readings below 30 typically suggest that selling has been extreme, driving prices to potential bargain levels. When a stock or even a broad swath of the market stays under this threshold for an extended period, it can be a powerful signal for investors seeking early signs of a turnaround.
rsioversold
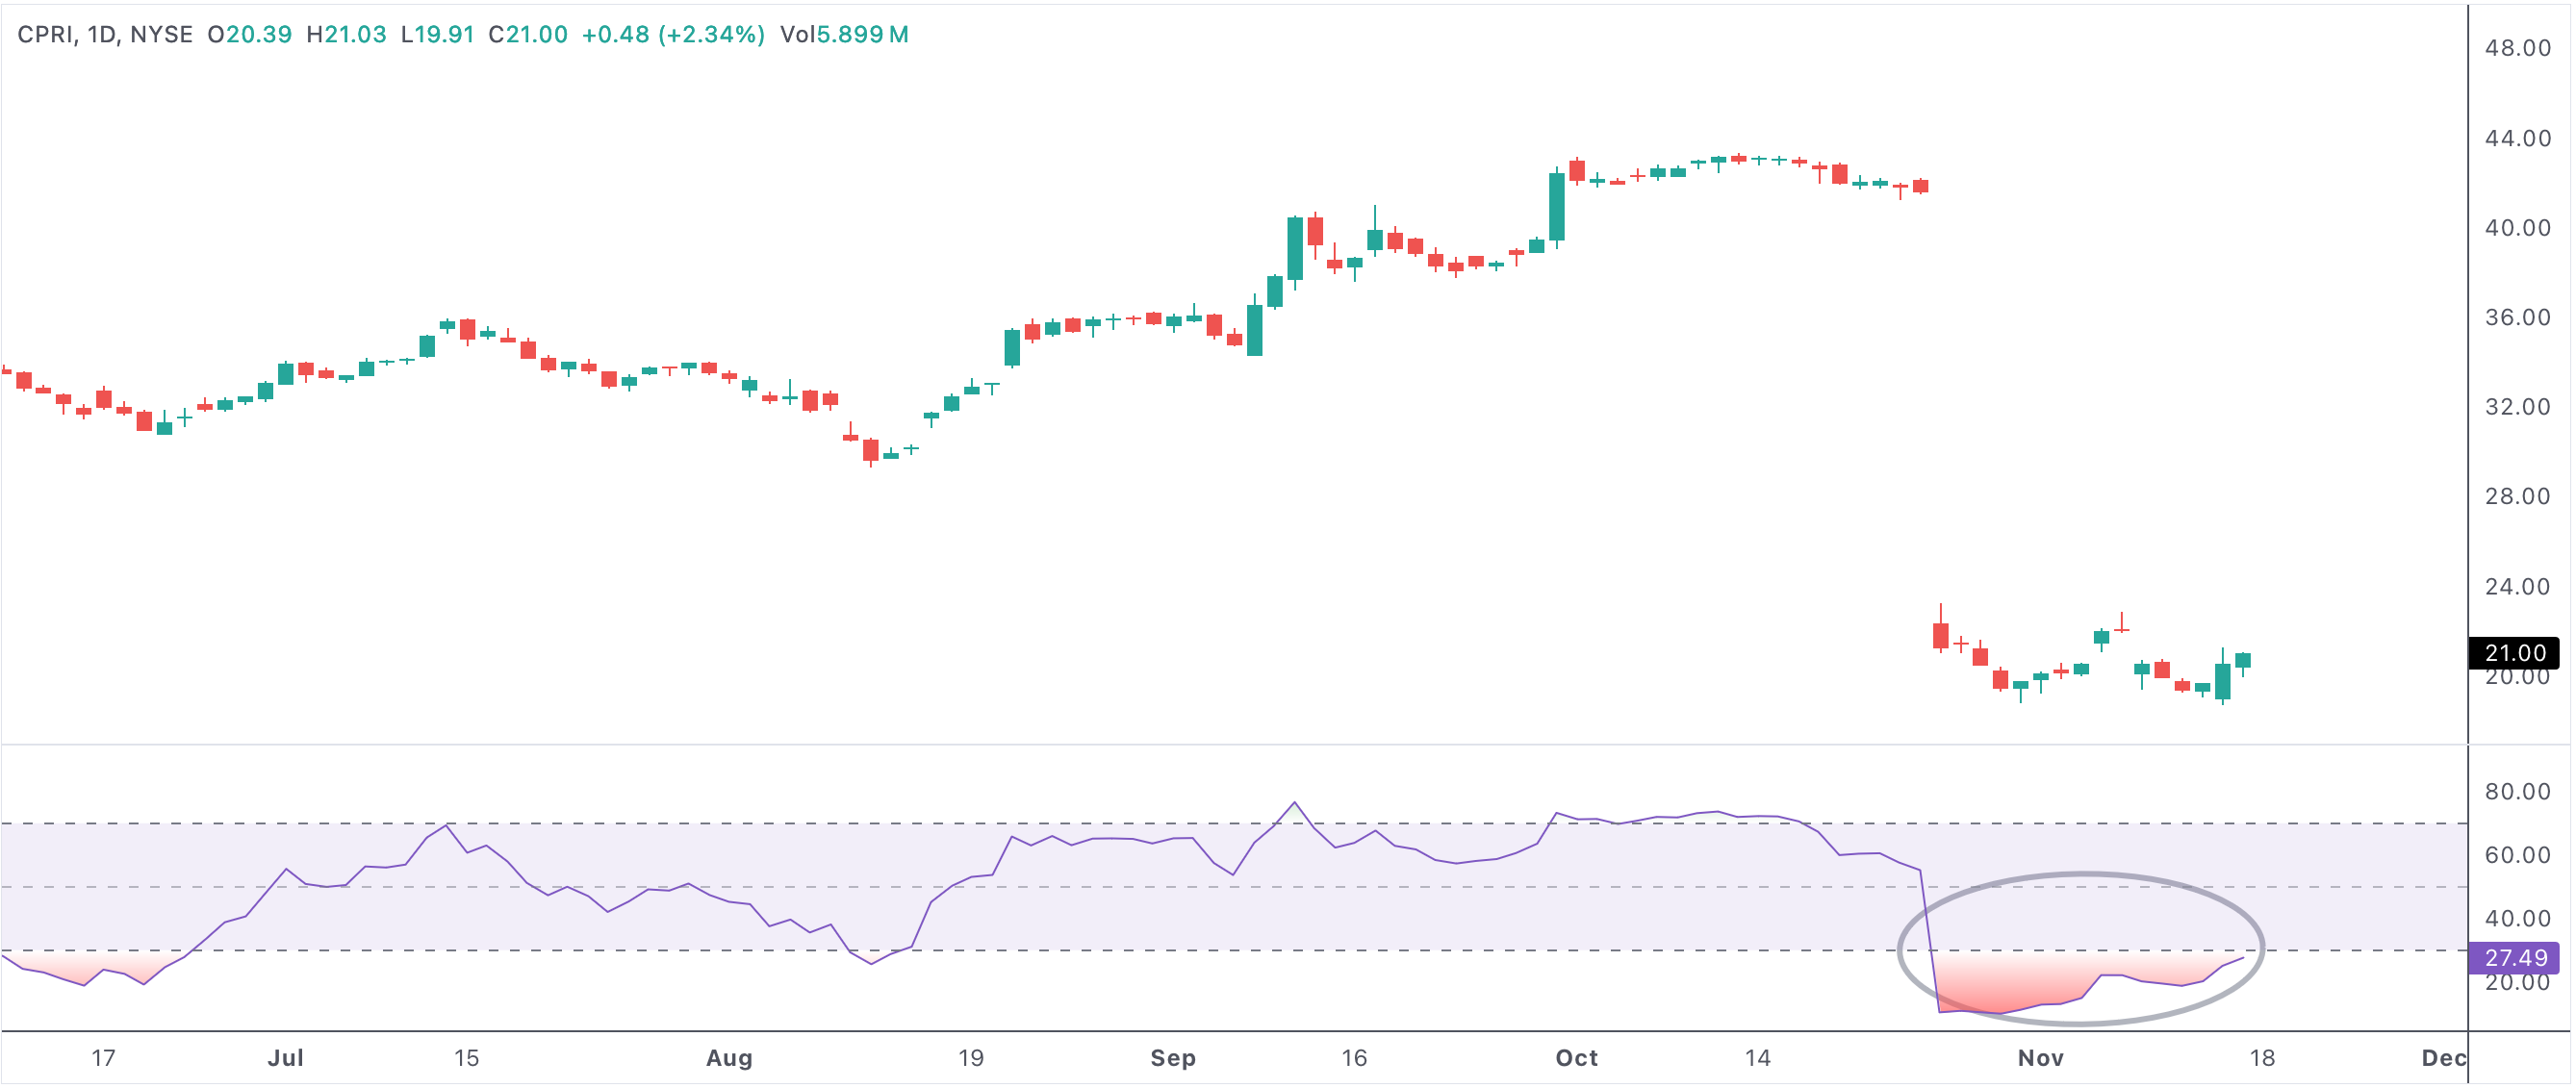
An example of a stock with the most consecutive days with RSI under 30
Most consecutive days with RSI under 30
Why RSI Under 30 Matters to Traders and Investors
The RSI measures the speed and change of price movements, fluctuating between 0 and 100. When RSI drops below 30, it indicates that recent price action has skewed heavily to the downside, suggesting a security is oversold and potentially undervalued. The longer a stock or index stays beneath this level, the more dramatic the signal that sellers may be exhausting themselves.
For investors and traders, spotting stocks with multiple consecutive days below 30 can highlight opportunities where market pessimism has peaked. These stocks often become attractive candidates for a bullish reversal, especially if broader market or economic conditions stabilize or improve.
What Prolonged Oversold Conditions Indicate
When several stocks or sectors experience extended periods with RSI readings under 30, it usually reflects a broader market correction or sector-specific stress. This can create a unique setup for investors with a contrarian mindset, as history shows markets often overreact to negative news, driving prices well below intrinsic value.
During these periods, institutional investors and funds may quietly begin to accumulate shares, positioning themselves for a rebound. Technical traders, meanwhile, watch for secondary signals—such as bullish divergence or price stabilization—to confirm that the selling has run its course.
RSI and the Psychology of Market Sentiment
The RSI’s power is rooted in its ability to quantify market sentiment. A high number of consecutive days under 30 often means panic selling or capitulation has occurred. While this may seem negative, these moments can set the stage for outsized gains as value-oriented buyers step in and sentiment gradually shifts from fear to optimism.
Market sentiment reversals can be triggered by positive earnings surprises, macroeconomic improvements, or simply a lack of further negative headlines. When this shift happens, stocks with the longest streaks of low RSI often bounce the hardest as shorts cover and new buyers rush in.
- Multiple consecutive days with RSI under 30 reflect persistent oversold pressure and potential undervaluation.
- These scenarios frequently create bullish reversal opportunities as selling pressure wanes.
- Institutional investors may accumulate positions during extended oversold periods.
- Confirmation with other technical signals—like volume spikes or support holds—strengthens the case for a reversal.
- Rising RSI above 30 from prolonged lows is a classic sign of recovering momentum and sentiment.
Building a Trading Strategy Around Oversold RSI Streaks
Traders looking to capitalize on oversold conditions should focus on risk management and confirmation. While a long streak of low RSI is a compelling signal, waiting for additional confirmation—such as a bullish candlestick pattern, a strong bounce in volume, or RSI breaking back above 30—can help reduce the risk of false starts.
Stops can be set just below recent lows to manage downside, while targets can be placed at prior resistance levels or moving averages. It's also wise to consider the broader market context; if the overall market is turning up from a correction, these deeply oversold stocks may outperform in the subsequent rally.
Summary: Turning Pessimism Into Opportunity
In summary, scanning for stocks with the most consecutive days with RSI under 30 is an effective way to identify extreme oversold conditions that often precede strong recoveries. By combining this technical insight with volume analysis, support and resistance levels, and awareness of broader sentiment shifts, traders and investors can find attractive opportunities and potentially position themselves ahead of bullish reversals.