Red Day Followed by a Bullish 2-Up Breakout That Closes Red
A red day followed by a bullish 2-up breakout that still closes red is a mixed reversal pattern. Under The Strat framework, price breaks above the prior candle's range, which is bullish, but the red close shows buyers were not strong enough to finish the session in full control. That creates a more conflicted signal than a clean green breakout. Traders often compare it with a red day followed by a bullish 2-up breakout that closes green, since the two setups show the difference between a confirmed bullish move and a weaker, more tentative one.
redredbull
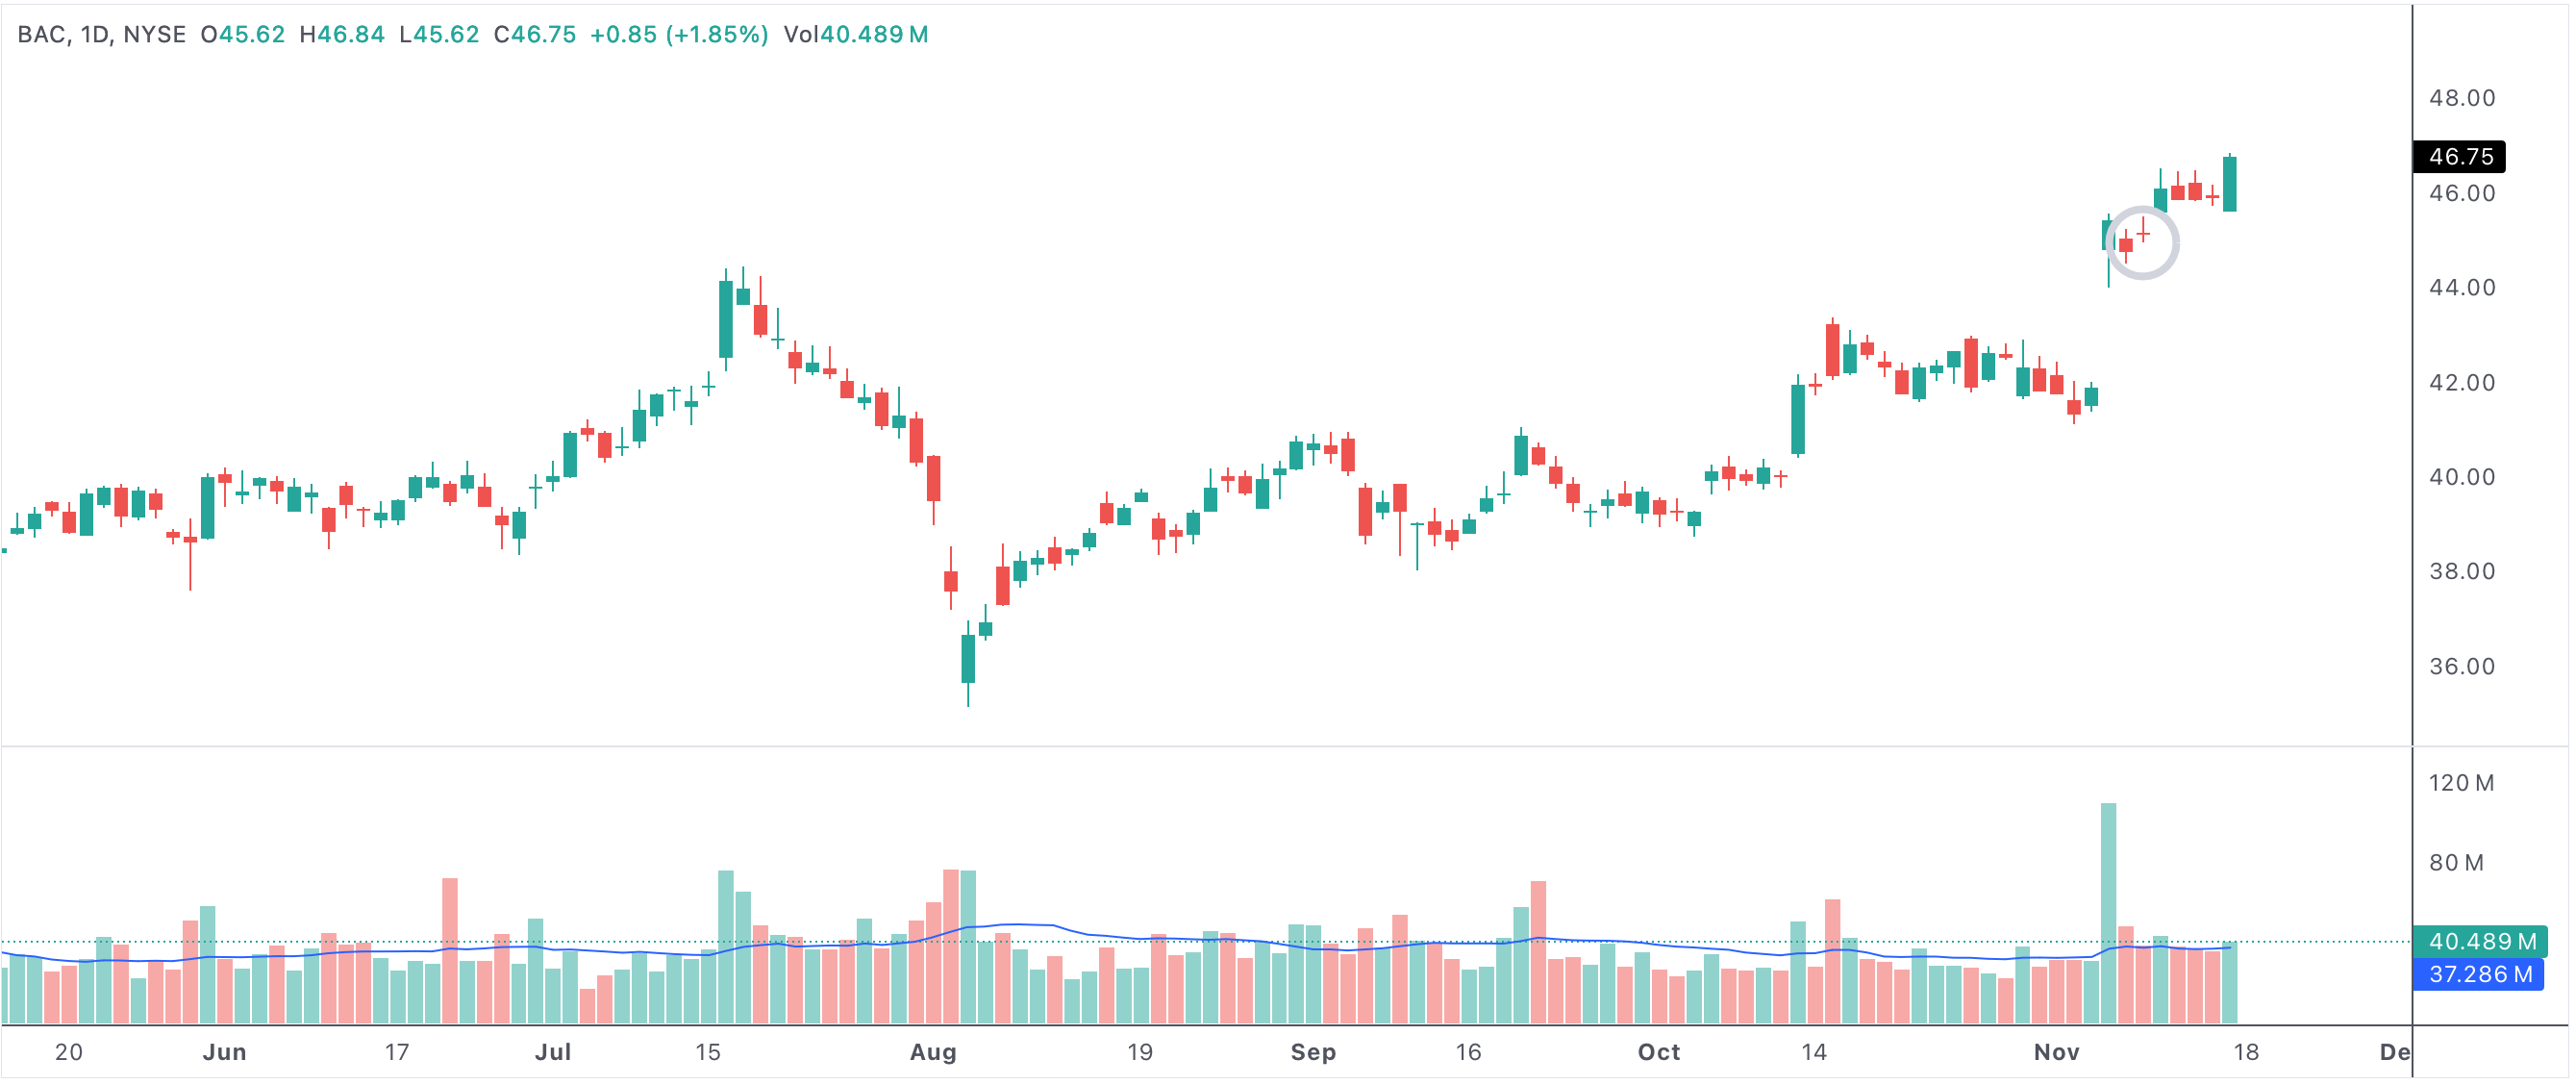
An example of a bullish 2-up breakout that still closes red.
Red day followed by a bullish breakout 2-up with the bar itself red
Why This Pattern Matters
This setup is useful because it shows buying interest was strong enough to break higher, but not strong enough to control the close. That conflict can mark an early reversal attempt, a weak bounce, or simple indecision depending on the broader chart.
It becomes more meaningful when it appears near support or after a sharp decline where buyers may be trying to take control.
How Traders Use It
Some traders treat this pattern as an early heads-up that a reversal may be forming. Others want more confirmation, such as a stronger next day or a green close above resistance. The key is recognizing that the breakout happened, but conviction was incomplete.
- The 2-up breakout shows bullish intent, but the red close shows hesitation.
- The setup is more conflicted than a clean bullish continuation candle.
- Support levels and next-day confirmation matter a lot.
- This pattern is best used as an alert, not as a standalone bullish signal.