RSI Oversold Condition Recovering - Early Signs of Momentum and Reversal
The Relative Strength Index (RSI) is a widely respected technical indicator used to identify potential reversal points in the stock market. When the RSI dips below 30, it often signifies that a stock or index is oversold, indicating that selling pressure has reached an extreme. However, once the RSI begins to recover and crosses back above the 30 threshold, it can serve as an early signal that bullish momentum is returning, and a potential reversal or trend change may be underway.
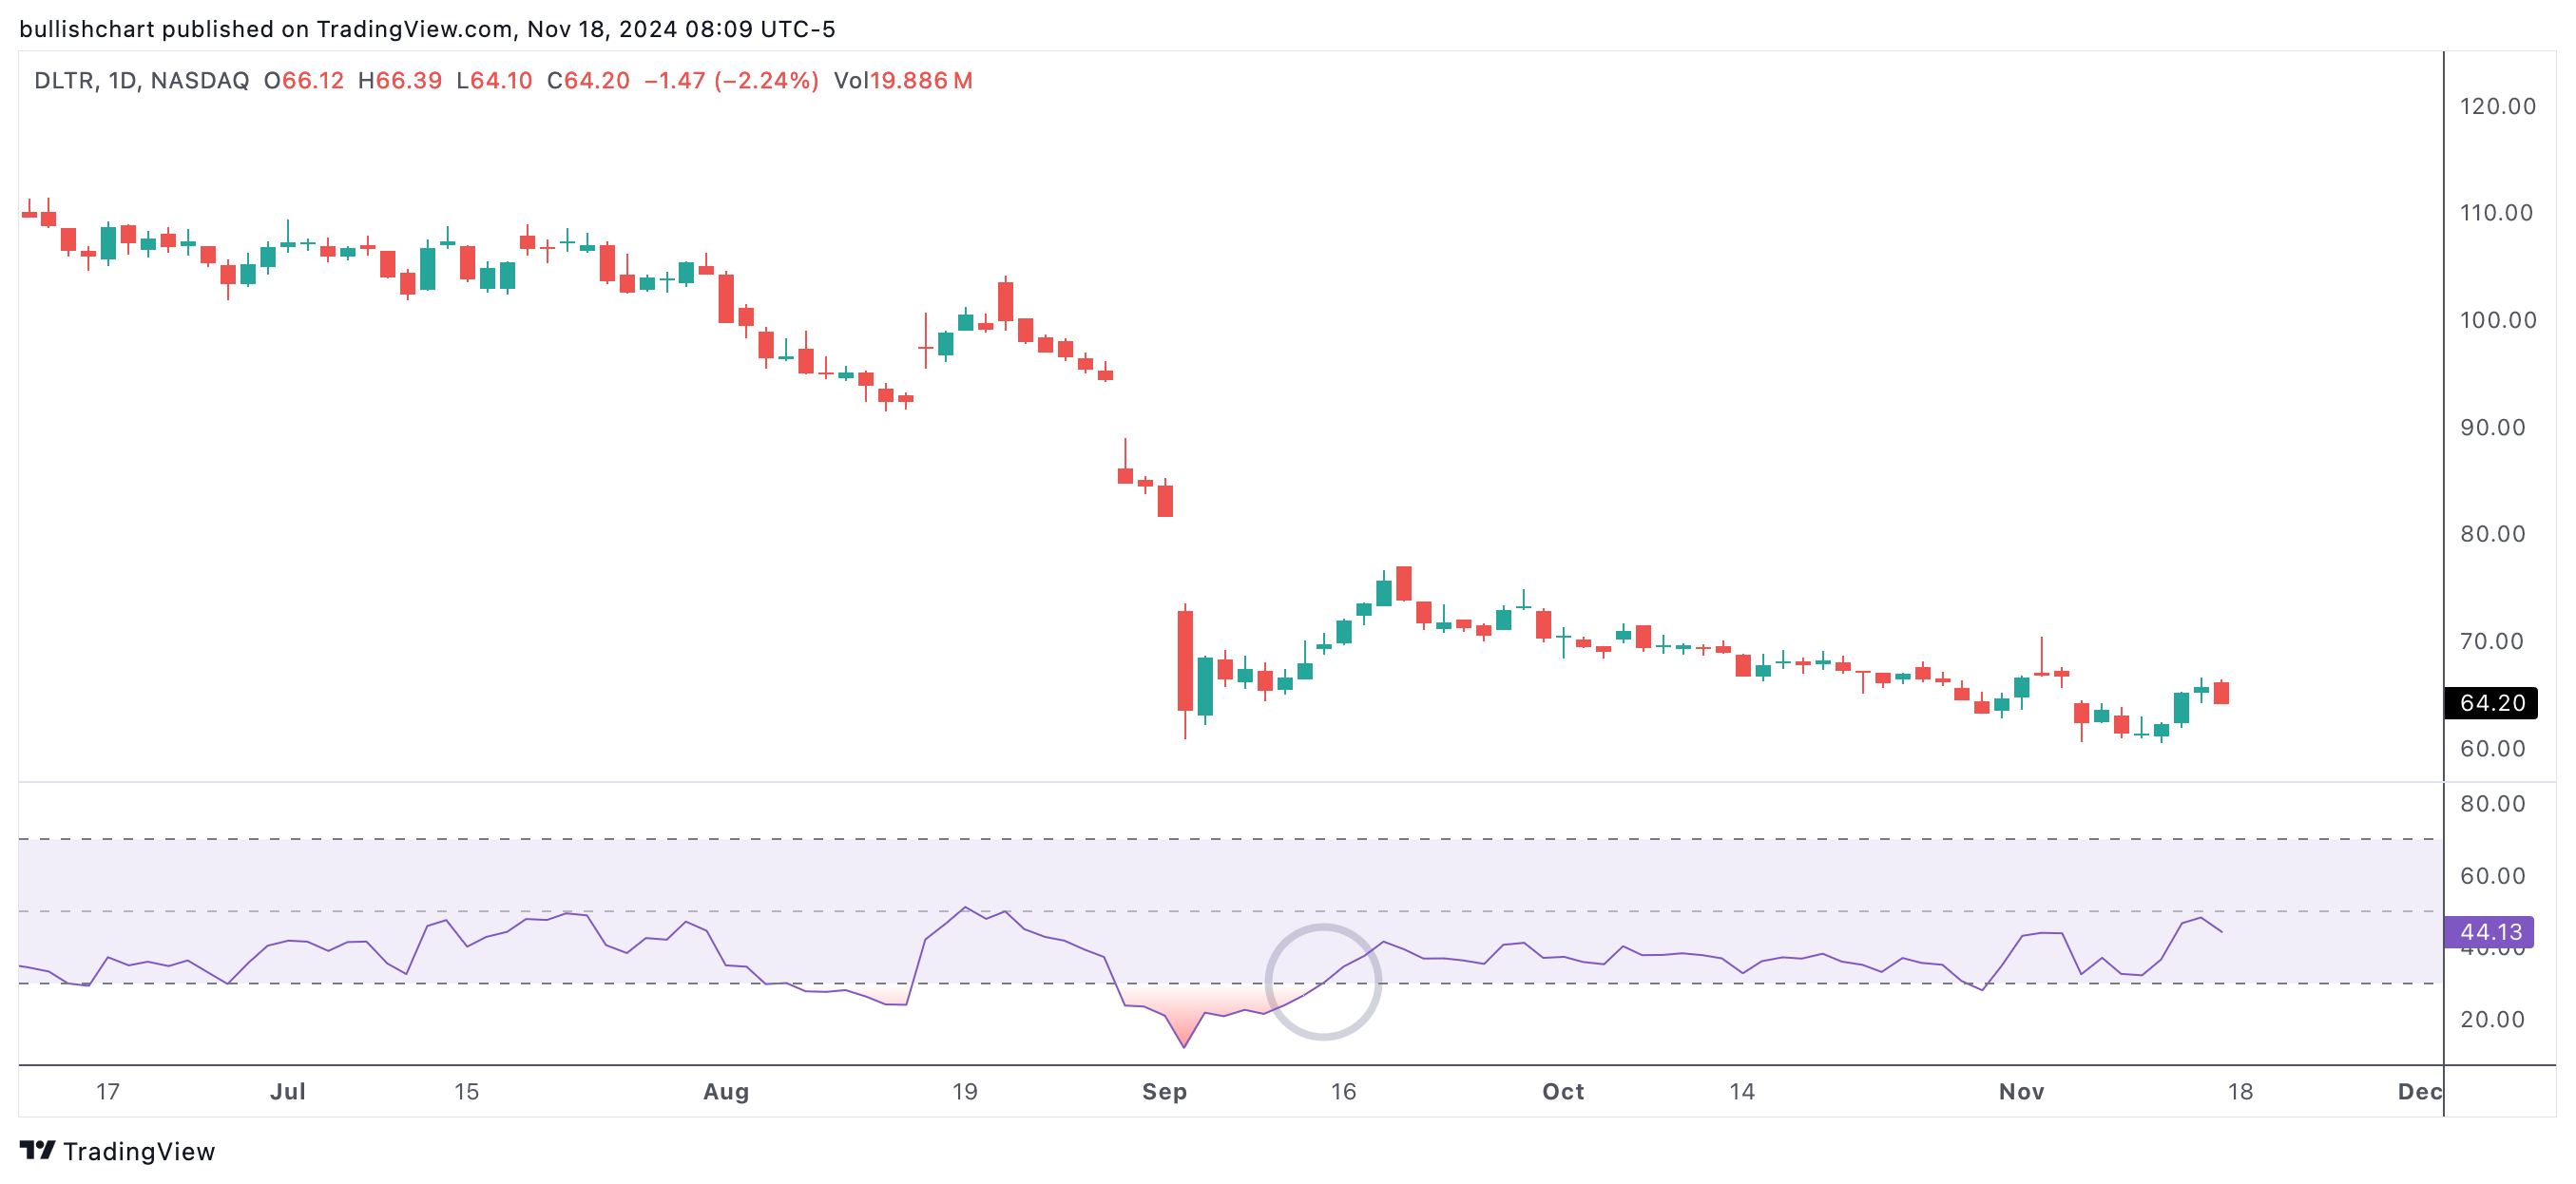
rsicrossup30
An example of a stock with an RSI oversold but beginning to recover
RSI oversold but beginning to recover
Understanding RSI Oversold Conditions
An RSI below 30 is commonly interpreted as an oversold condition, meaning the price has declined rapidly and may have become undervalued in the short term. This scenario often results from excessive selling, panic, or negative news, which can push prices to unsustainably low levels. While an oversold RSI alone does not guarantee an immediate turnaround, it puts the asset on watch for a possible reversal if buying interest returns.
The Bullish Implications of RSI Recovery
When the RSI moves back above 30, it can indicate that selling pressure is fading and buyers are beginning to step in. This recovery is often seen as an early bullish signal, particularly if it is confirmed by other technical indicators or improving market sentiment. Investors watching for momentum reversals may use this as a trigger to look for entry points, hoping to capture gains as the asset rebounds from oversold levels.
- RSI crossing above 30 signals the end of an oversold period and the potential start of a new uptrend.
- This setup can attract traders seeking to capitalize on early-stage reversals.
- If supported by positive volume or price action, the recovery has a higher chance of sustaining.
- Monitoring market sentiment helps confirm that the shift is not just a short-term bounce.
- Combined with other technical indicators, RSI recovery above 30 adds weight to the bullish case.
Why RSI Recovery Appeals to Investors
Many investors prefer to enter positions after confirmation of a momentum shift, rather than trying to time the exact bottom. The RSI’s move above 30 is a practical and simple signal to watch for potential trend changes. This approach can help avoid “catching a falling knife” and instead positions investors to benefit from the early phase of a recovery as buying pressure increases and sentiment stabilizes.
Risks and Confirmation Techniques
While an RSI recovery above 30 is a promising sign, it is not infallible. False signals can occur, especially during strong downtrends where brief recoveries may not be sustained. To improve reliability, traders often pair the RSI signal with confirmation from price patterns, candlestick analysis, or other momentum indicators. Watching for increased trading volume, higher lows in price, or bullish divergence with other indicators can further validate the reversal.
Summary: RSI Recovery as a Bullish Momentum Shift
In summary, RSI oversold but beginning to recover marks a key moment for market participants. The signal suggests that intense selling is abating and that bullish momentum may be building. This condition attracts investors looking for early opportunities in a potential trend reversal. By combining RSI recovery signals with other forms of technical and sentiment analysis, traders can more confidently identify strong setups for possible upward moves in the market.