Stochastic K cross down 90 - identifying pullbacks and pauses in uptrends
The Stochastic K cross down 90 is a technical event that can provide valuable insight into the state of a stock’s momentum. When the Stochastic K line—an essential component of the popular stochastic oscillator—crosses below the 90 level, it typically signals that a stock is transitioning from an overbought condition. While often seen in strong uptrends, this signal does not necessarily warn of an imminent reversal. Instead, it tends to indicate a potential pause, pullback, or short-term consolidation in the broader trend.
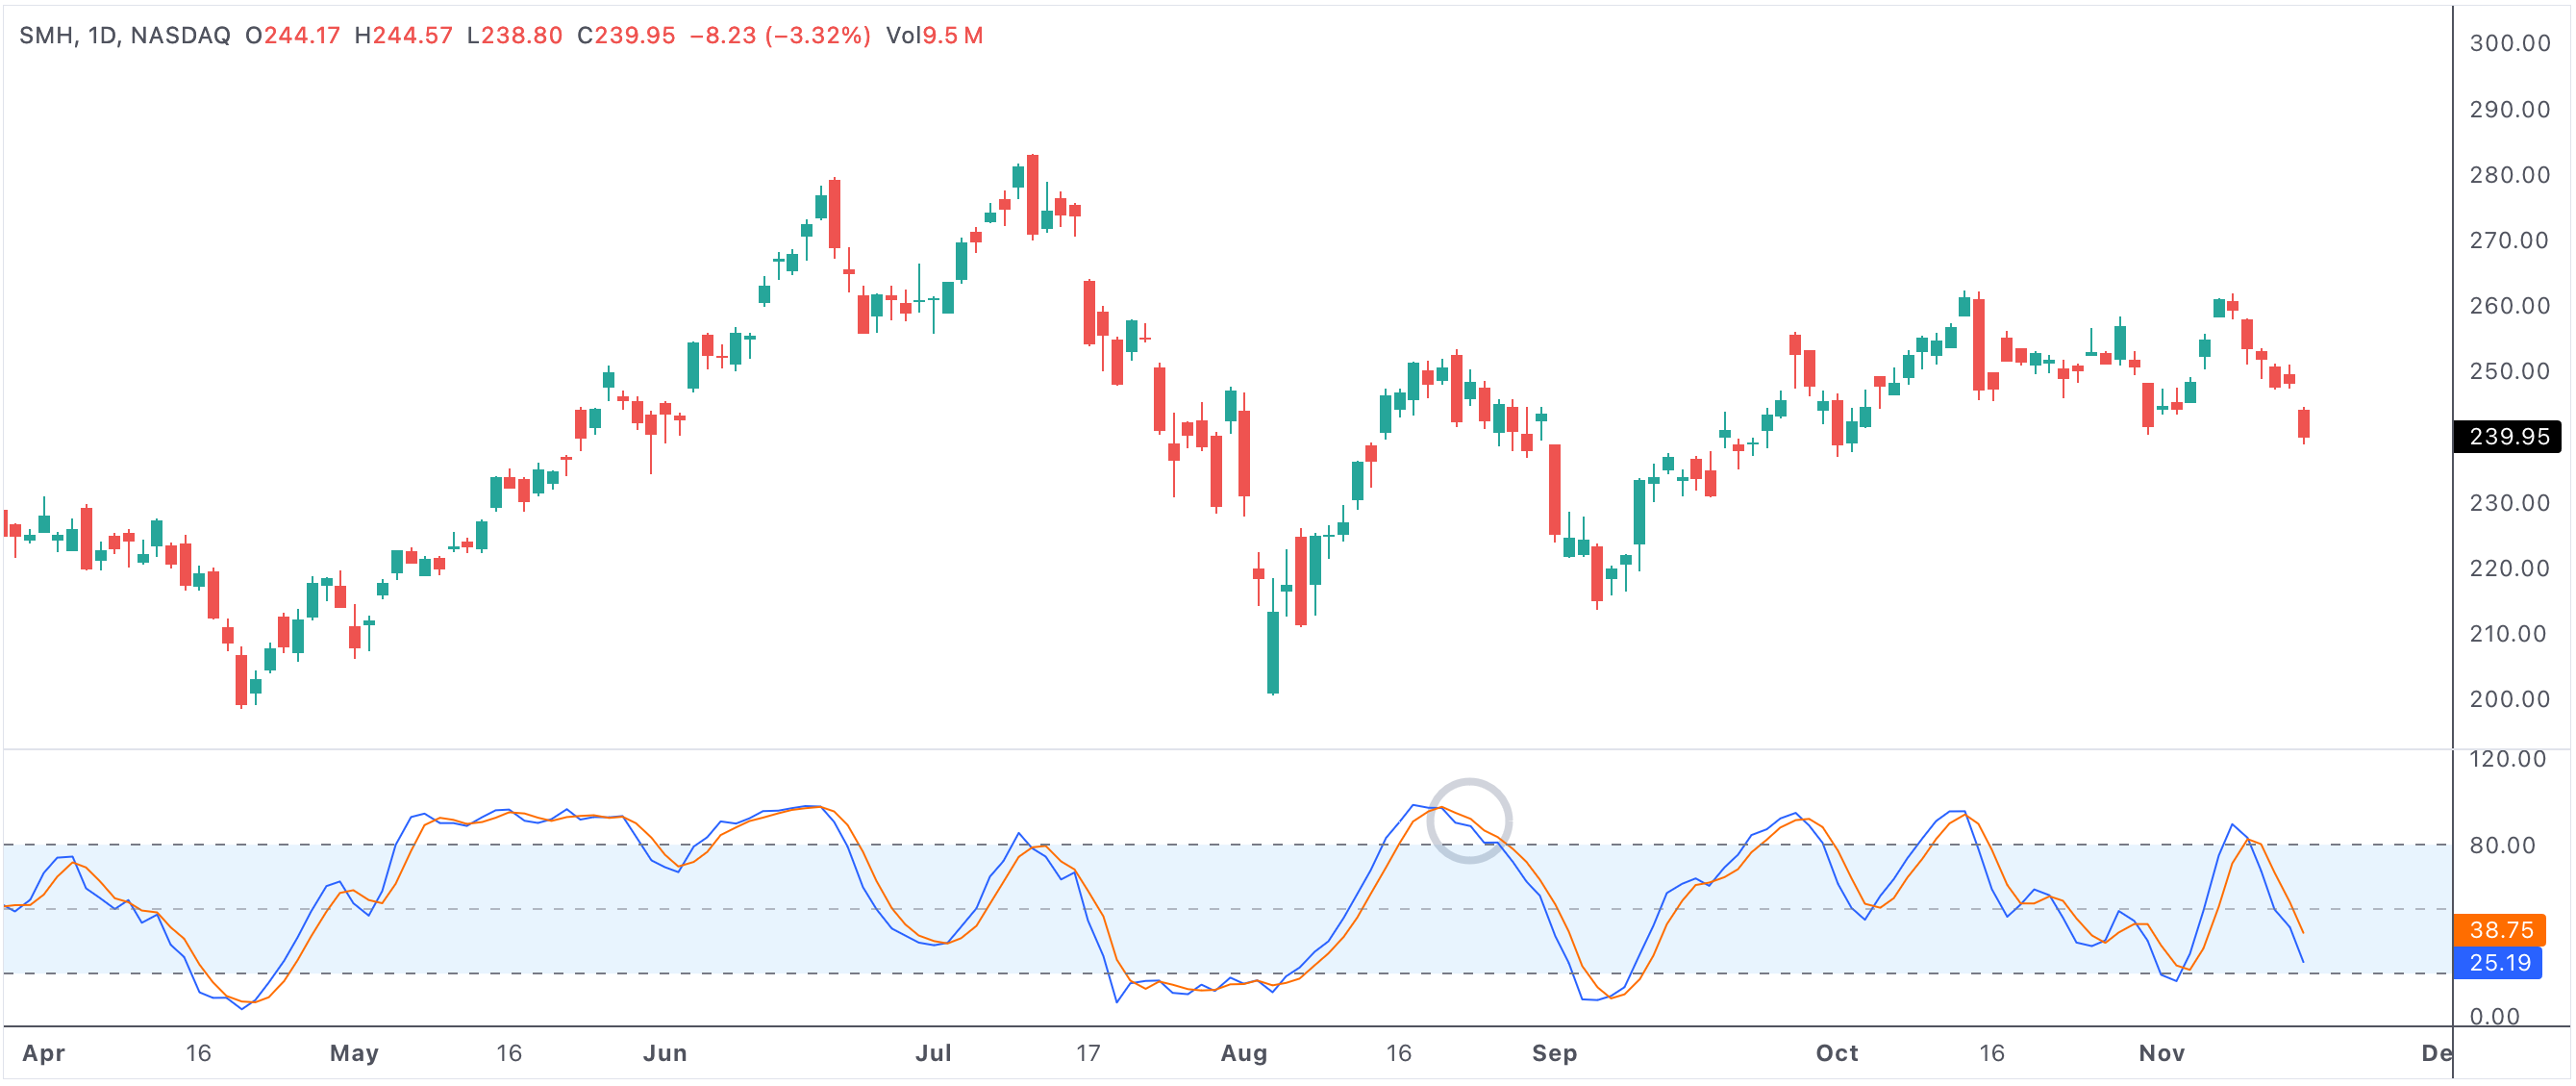
stochkcrossdown90
An example of a stock with the Stochastic K crossing down 90
Stochastic K cross down 90
Understanding the Stochastic K Indicator
The Stochastic K indicator is a momentum oscillator developed by George Lane, designed to compare a stock's closing price to its recent price range. Readings near or above 90 often indicate overbought conditions, while values below 10 suggest oversold territory. When the Stochastic K line is above 90 and then crosses below this level, it reflects a cooling of extreme buying pressure—a natural part of market cycles.
What Does a Cross Down Through 90 Signal?
In strong uptrends, it’s common for the Stochastic K to remain overbought for extended periods. However, when it crosses down through the 90 threshold, it often acts as an early sign that the prevailing buying momentum is starting to ease. This can be due to profit-taking, a loss of short-term enthusiasm, or a shift in market sentiment. Importantly, this does not mean the uptrend is over; it may simply be time for the stock to rest or digest previous gains.
- A Stochastic K cross down 90 often signals a short-term pause in the uptrend.
- This event typically alerts traders to the possibility of a pullback or consolidation phase.
- It reflects cooling momentum rather than an outright bearish reversal, especially when fundamentals remain intact.
- Volume and other technical indicators can provide confirmation and context to the signal.
Trading Strategies and Interpretation
Many traders use the Stochastic K cross down 90 in combination with other technical indicators. For example, if the stock remains above major moving averages and overall trend structure is healthy, a cross down through 90 may be viewed as a buying opportunity on weakness rather than a sell signal. Some traders will wait for additional confirmation—such as a bullish reversal candlestick pattern, support at a key moving average, or positive divergence in other momentum indicators—before entering or adding to a position.
Conversely, if the cross down 90 occurs alongside a break of trendline support, negative volume patterns, or broader market weakness, it may indicate the start of a deeper correction.
Examples and Market Context
In many uptrending stocks, Stochastic K can cross down through 90 multiple times as price ebbs and flows within the larger move. Each instance can serve as a decision point for traders managing risk or seeking fresh entry points. In particularly strong markets, stocks may recover quickly after a shallow pullback, reaffirming the uptrend. However, if the cross down is accompanied by heavy selling and a break below recent support, caution is warranted.
Summary: Using Stochastic K Cross Down 90 in Your Trading
The Stochastic K cross down 90 is an important signal for those tracking momentum and overbought conditions in uptrending stocks. While it can point to short-term pauses and corrections, its true value lies in context—how price responds after the signal and what supporting indicators reveal. By understanding this dynamic, traders can better time entries, manage positions, and respond to the natural rhythms of strong price trends.