Stochastic K Cross Up 10 - Early Signal of Momentum Shift and Stock Reversal
The Stochastic K cross up 10 is a key technical analysis event that occurs when the Stochastic K line, a core component of the Stochastic Oscillator, crosses above the 10 level. This movement signals a potential end to an oversold condition, suggesting that bearish momentum may be losing its grip and that a price recovery or reversal could be on the horizon. For traders and investors seeking early entries into a possible bullish trend, this technical pattern serves as an alert that the stock may be bottoming out and preparing for a rebound.
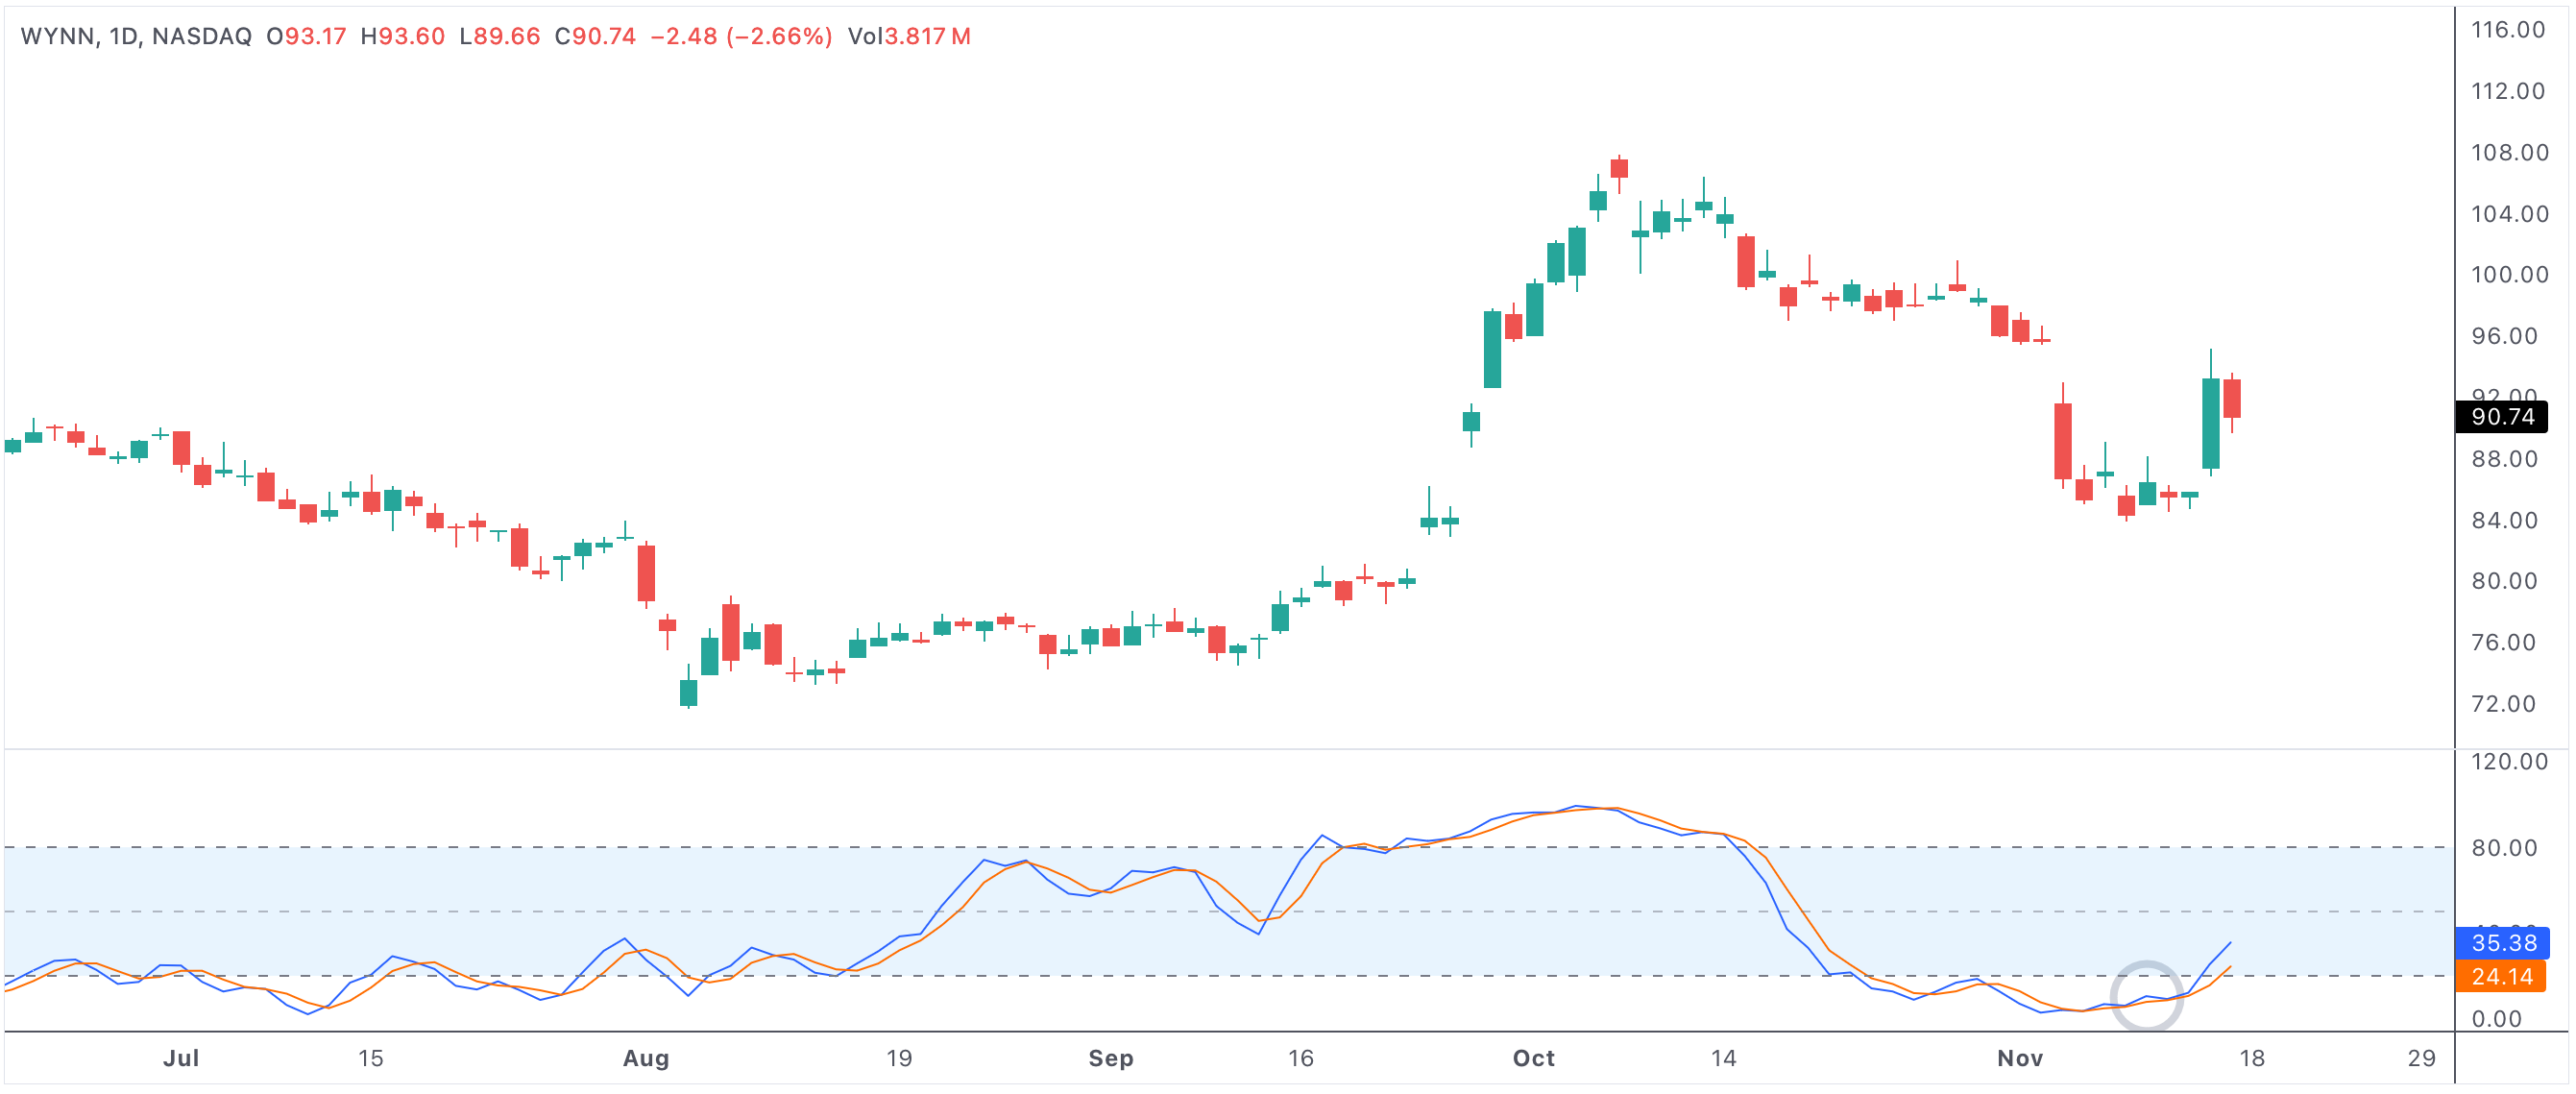
stochkcrossup10
Example of a stock where the Stochastic K line has crossed up through the 10 level, signaling a shift from oversold conditions.
Stochastic K cross up 10
What is the Stochastic K Cross Up 10?
The Stochastic Oscillator is a momentum indicator comparing a stock’s closing price to its price range over a specific period. The K line is the faster-moving line in the indicator and is especially sensitive to quick price changes. When the K line crosses up through the 10 level, it indicates that the stock has moved out of a deeply oversold zone—a region where aggressive selling may have pushed prices down too far, too fast. This action frequently marks the first sign that sellers are losing conviction, and buyers could soon take control.
Why Is This Signal Important?
A Stochastic K cross up 10 is widely monitored by technical traders because it suggests a shift in momentum. When a stock has been heavily sold and the Stochastic K line begins to climb out of single digits, it often precedes a price bounce or even the start of a larger reversal. The signal’s reliability increases when it aligns with other bullish factors—such as rising volume, bullish candlestick patterns, or strong support levels on the chart.
- Momentum shift: Indicates that downward pressure is easing and buyers may be returning.
- Early entry: Provides an early warning for those looking to catch a potential reversal from oversold territory.
- Psychological effect: Signals to traders that selling may have been overdone, inviting fresh interest.
How Do Traders Use Stochastic K Cross Up 10?
Traders and investors use this signal as part of a broader strategy to identify buying opportunities. Some may enter positions as soon as the cross is confirmed, while others may wait for additional confirmation from price action or other technical indicators (such as RSI moving above 30 or a bullish MACD crossover). For short-term traders, the Stochastic K cross up 10 can serve as a setup for a quick bounce play, while swing traders might use it as the first sign of a more significant trend reversal.
It's especially effective when observed in stocks with high relative volume or when the cross up coincides with fundamental catalysts, such as positive earnings news or sector-wide rallies. Risk-conscious traders often place stop-loss orders just below recent lows to manage downside in case the reversal doesn’t hold.
Limitations and Confirmation
While a Stochastic K cross up 10 is a valuable early warning of a potential bottom, it’s not foolproof. False signals can occur, especially in markets experiencing strong, persistent downtrends or during periods of high volatility. That’s why experienced traders often combine this indicator with other technical tools, chart patterns, and even fundamental analysis before making significant decisions.
Summary: Spotting Early Shifts from Oversold
The Stochastic K cross up 10 is an essential signal for traders who want to spot early signs of bullish reversals from oversold conditions. It marks a potential momentum shift and highlights a fading of bearish sentiment. Used alongside volume analysis and other indicators, this setup can provide a high-probability edge for catching market rebounds and positioning for recovery rallies. Always confirm the signal and manage risk for best results.