Stochastic K Cross Up 20 - Early Bullish Signal from Oversold Territory
The Stochastic K cross up 20 is a key technical signal for traders searching for early signs of a trend reversal and renewed bullish momentum. When the stochastic oscillator’s %K line crosses above the 20 level, it’s typically interpreted as the first indication that a stock or asset is emerging from oversold conditions and may be starting a new upward phase. This moment often attracts the attention of technical analysts and traders who monitor momentum indicators for timely entry opportunities.
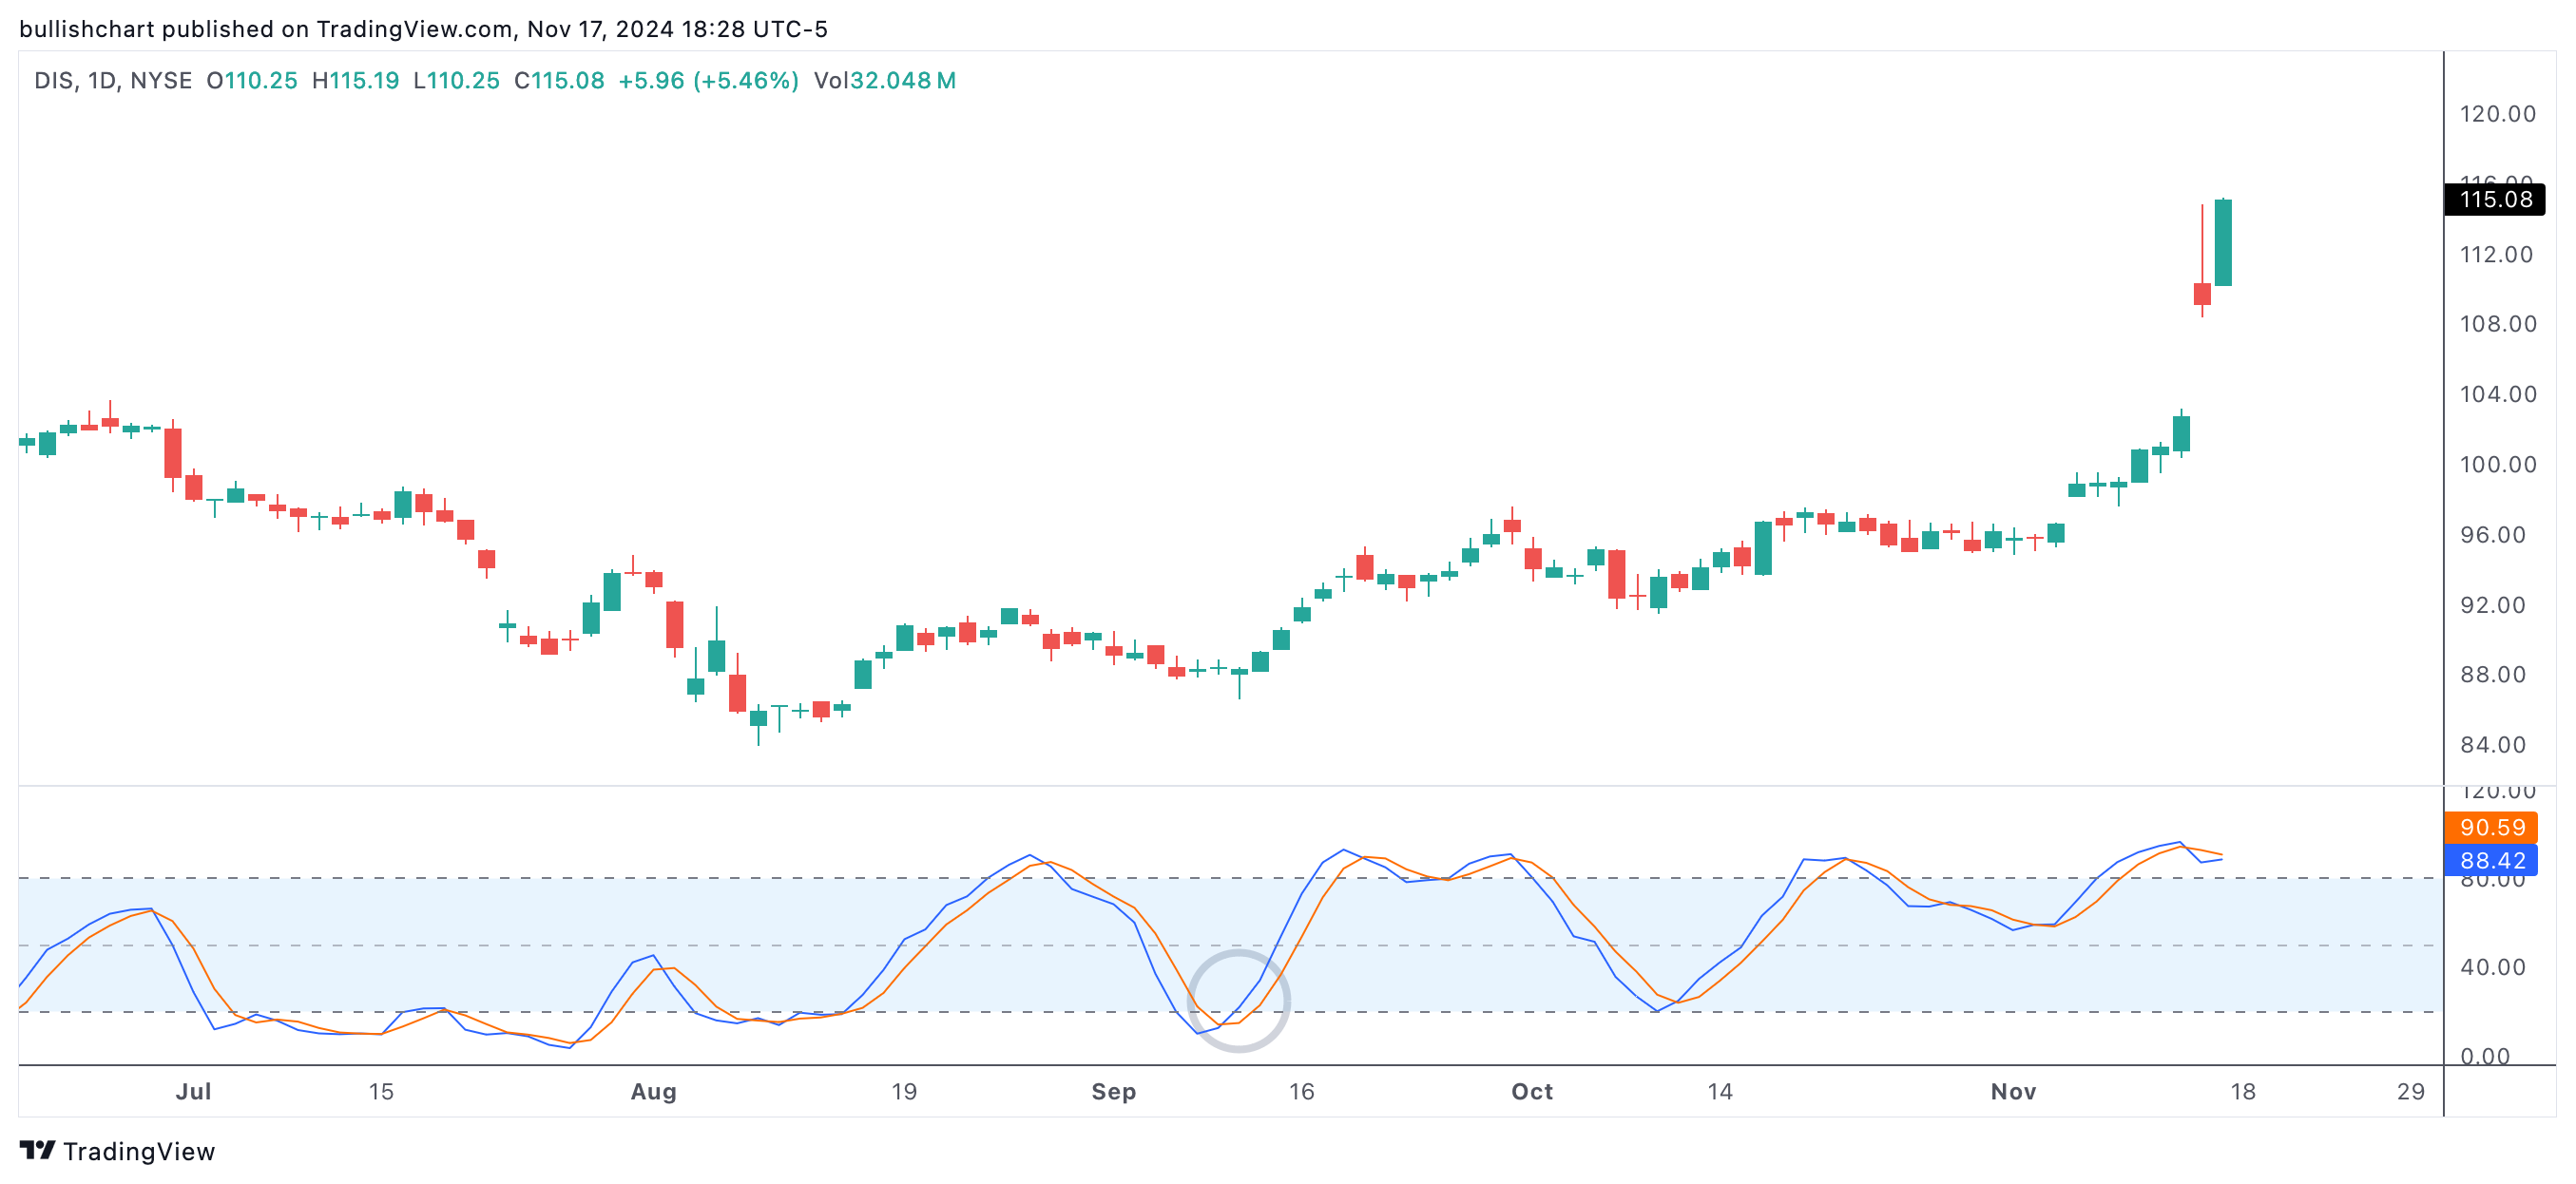
stochkcrossup20
An example of a stock with a stochastic K crossing up 20
Stochastic K cross up 20
What Does Stochastic K Cross Up 20 Mean?
The stochastic oscillator measures the position of a closing price relative to its recent trading range. The 20 level is traditionally viewed as the threshold for “oversold.” When the %K line rises above this level, it signals that downward pressure may be dissipating and the asset could be preparing for a reversal or an initial bounce higher. This indicator can help traders identify early changes in sentiment, before the broader market fully reacts.
Why Is the 20 Level Important?
The 20 threshold on the stochastic oscillator marks the dividing line between prolonged selling and the start of potential accumulation. A cross up through this level doesn’t guarantee a trend change, but it is often the first sign that bears are losing control and buyers are testing the waters. For many market participants, this is the ideal spot to watch for confirmation from other technical indicators or price action setups. In fast-moving markets, signals at this level can precede strong short-term rallies.
- Momentum shift: Indicates that bearish pressure is weakening and bullish interest is increasing.
- Early entry point: Used by traders to identify opportunities at the start of new trends.
- Works best in oversold conditions: The lower the stochastic reading before the cross, the more meaningful the signal.
How to Trade the Stochastic K Cross Up 20
Traders often look for additional confirmation when acting on a stochastic cross above 20. This may include bullish candlestick patterns, rising volume, or confirmation from other momentum or trend indicators such as RSI or MACD. Combining signals helps reduce the chance of acting on a false breakout. Some traders will set stop-loss orders below the recent swing low, managing risk if the reversal doesn’t materialize.
Patience is important, as oscillators can sometimes produce whipsaw signals in volatile markets. Waiting for a close above 20, or for the %K line to hold above 20 for several sessions, can help filter out noise and provide a more robust signal.
Stochastic K Cross Up 20 in Context
The reliability of the stochastic K cross up 20 can increase when it occurs near major support levels, after a substantial decline, or in conjunction with other reversal signals. Institutional traders and algorithms often scan for this event as a potential “first alert” that a previously ignored or beaten-down stock could be about to see renewed demand. When combined with positive news or fundamental catalysts, this technical event can mark the beginning of a larger recovery.
Stochastic Oscillator vs. Other Indicators
Compared to RSI, the stochastic oscillator tends to be more sensitive to sudden price changes, generating quicker signals. While RSI highlights overbought and oversold areas on a broader scale, the stochastic is particularly useful for spotting short-term shifts. When used alongside MACD, the stochastic can alert traders to momentum shifts before longer-term trends emerge. Watching for divergence between the stochastic oscillator and price action can further strengthen the signal.
Summary: Spotting Early Bullish Momentum
The Stochastic K cross up 20 is a widely followed early indicator for spotting bullish momentum as stocks recover from oversold territory. When supported by other forms of technical analysis and sound risk management, it can help traders position themselves at the start of an upward move, taking advantage of renewed buying interest before trends become obvious to the wider market.