Stochastic oscillator bearish cross warns of selling momentum and reversal risk
The stochastic oscillator bearish cross is a classic technical analysis signal that alerts traders and investors to a possible shift in momentum. This signal occurs when the fast %K line of the stochastic oscillator crosses below the slower %D line, generally after a rally or a period of upward price action. The stochastic oscillator itself is designed to compare a security's closing price to its price range over a specific time period, most commonly 14 periods. The bearish cross is widely viewed as a warning that selling pressure is increasing, and that the recent trend may be losing steam.
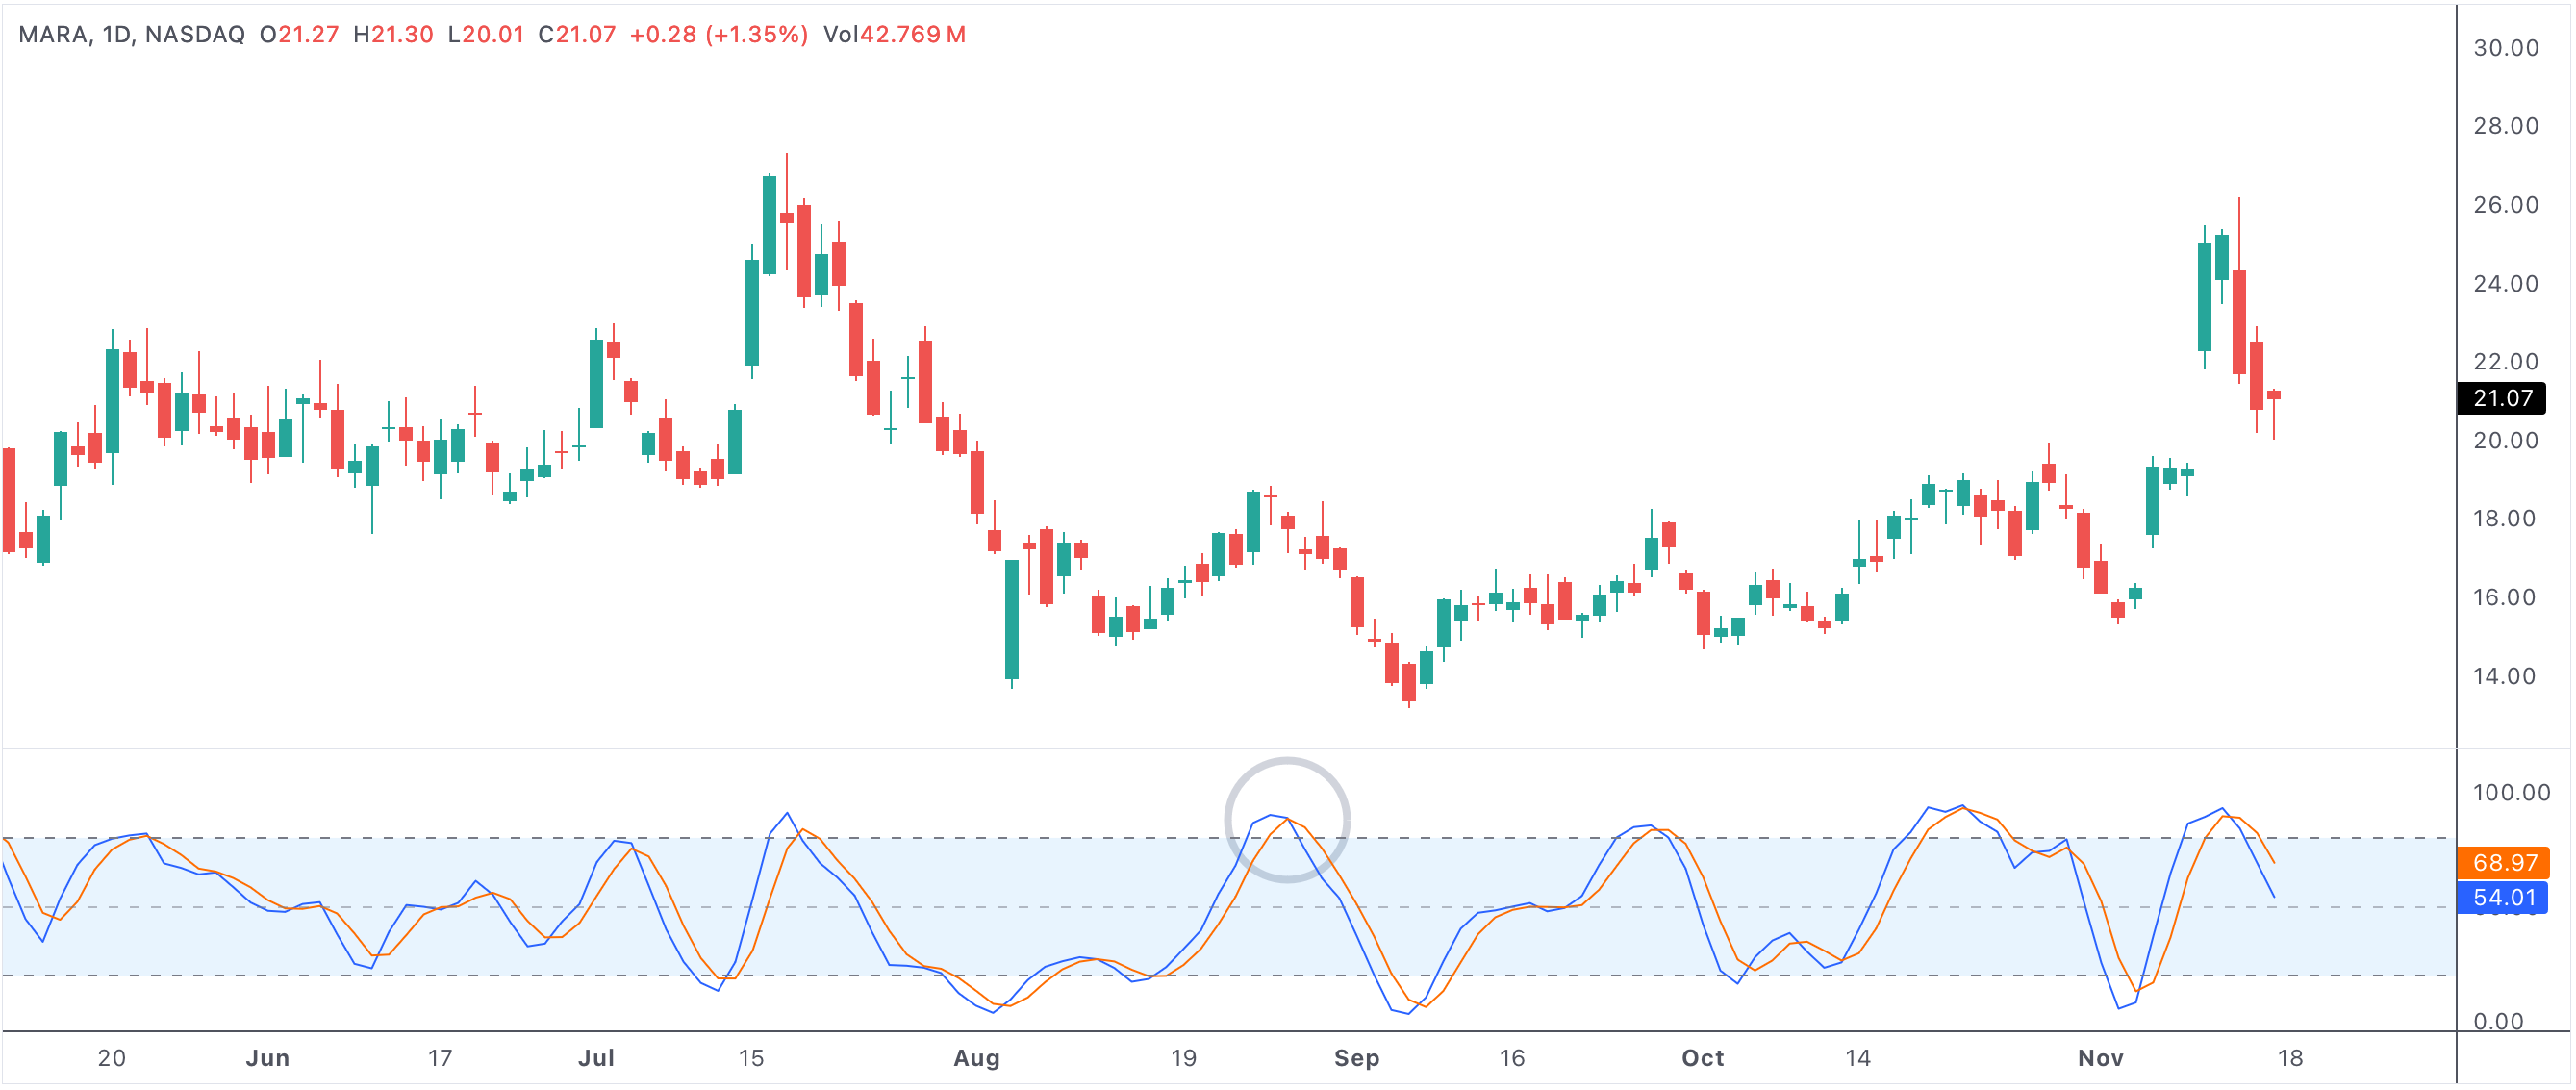
stochkcrossdownd
A technical chart showing a stochastic oscillator bearish cross, a classic warning of momentum shift.
Stochastic oscillator bearish cross
What Does the Stochastic Oscillator Bearish Cross Mean?
When the stochastic oscillator’s %K line crosses below the %D line, it indicates that recent closing prices are beginning to trend lower within their range. This typically signals the end of a bullish phase or a weakening of positive momentum. For traders, this is often seen as an opportunity to lock in profits or prepare for a possible downward move. For long-term investors, it may serve as an early caution sign to review exposure or tighten risk controls.
Why Is This Signal Important?
The significance of a stochastic oscillator bearish cross increases if it happens while the indicator is above 80, which is considered the overbought zone. In these scenarios, the cross suggests that the asset could be vulnerable to a price correction or at least a pullback as buyers lose interest and sellers step in. It’s also a popular signal among traders who look for short-term reversals, as the oscillator can be particularly responsive to price swings in volatile stocks.
Potential for Reversal at Support Levels
Not every bearish cross leads to an extended downtrend. Sometimes, the signal appears as the price approaches a significant support level. In this case, the bearish momentum indicated by the cross may be short-lived, as buyers often see these dips as opportunities to enter positions at more attractive prices. If buying activity picks up near support, the bearish signal can quickly turn into a catalyst for a bullish reversal.
- Momentum shift: A bearish cross suggests selling pressure is increasing and the prior trend is weakening.
- Overbought warning: The signal is most powerful when it happens in overbought conditions above 80.
- Reversal potential: The cross can mark the start of a new downtrend or, near support, a temporary pullback before buyers step in.
- Confirmation matters: Traders often seek other signals, like volume spikes or support breaks, to confirm the bearish cross.
- Opportunity for buyers: The move can create oversold conditions, drawing in buyers who anticipate a rebound.
How Traders Use the Stochastic Bearish Cross
Active traders may use the stochastic oscillator bearish cross as a signal to initiate short trades or exit long positions, especially if other technical indicators align. It’s common to wait for confirmation—such as a close below a support level or a concurrent signal from RSI or MACD—before taking action. Some traders also monitor price action closely following the cross to watch for bullish reversal candlesticks or renewed buying volume as an early sign of a bounce.
Risk Management and False Signals
As with any indicator, the stochastic oscillator is not infallible. False signals can occur, particularly in choppy or sideways markets. This is why most experienced traders use the stochastic cross in conjunction with broader analysis, including chart patterns, volume studies, and trendline support or resistance. Good risk management, such as stop losses or scaling out of trades, helps mitigate the risk of acting on a single indicator alone.
Summary: An Early Warning for Shifting Momentum
The stochastic oscillator bearish cross remains a popular and reliable early warning of potential momentum shifts and short-term trend reversals. While it often points to growing selling pressure and possible price corrections, it can also set up bullish opportunities as buyers look for value near support. Understanding how to interpret this signal—within the context of the overall market environment—can help traders and investors make better, more informed decisions.