Stochastic Oscillator Bullish Cross - Early Signal for Momentum and Reversal
The stochastic oscillator bullish cross is one of the most recognized technical signals for traders watching for early signs of upward momentum and potential trend reversals in stocks. This signal occurs when the %K line of the stochastic oscillator crosses above the %D line, typically after a period of selling that has pushed the indicator into oversold territory. The resulting crossover is interpreted by technical analysts as a sign that selling pressure is dissipating and buyers are starting to gain control, potentially setting the stage for a price rebound.
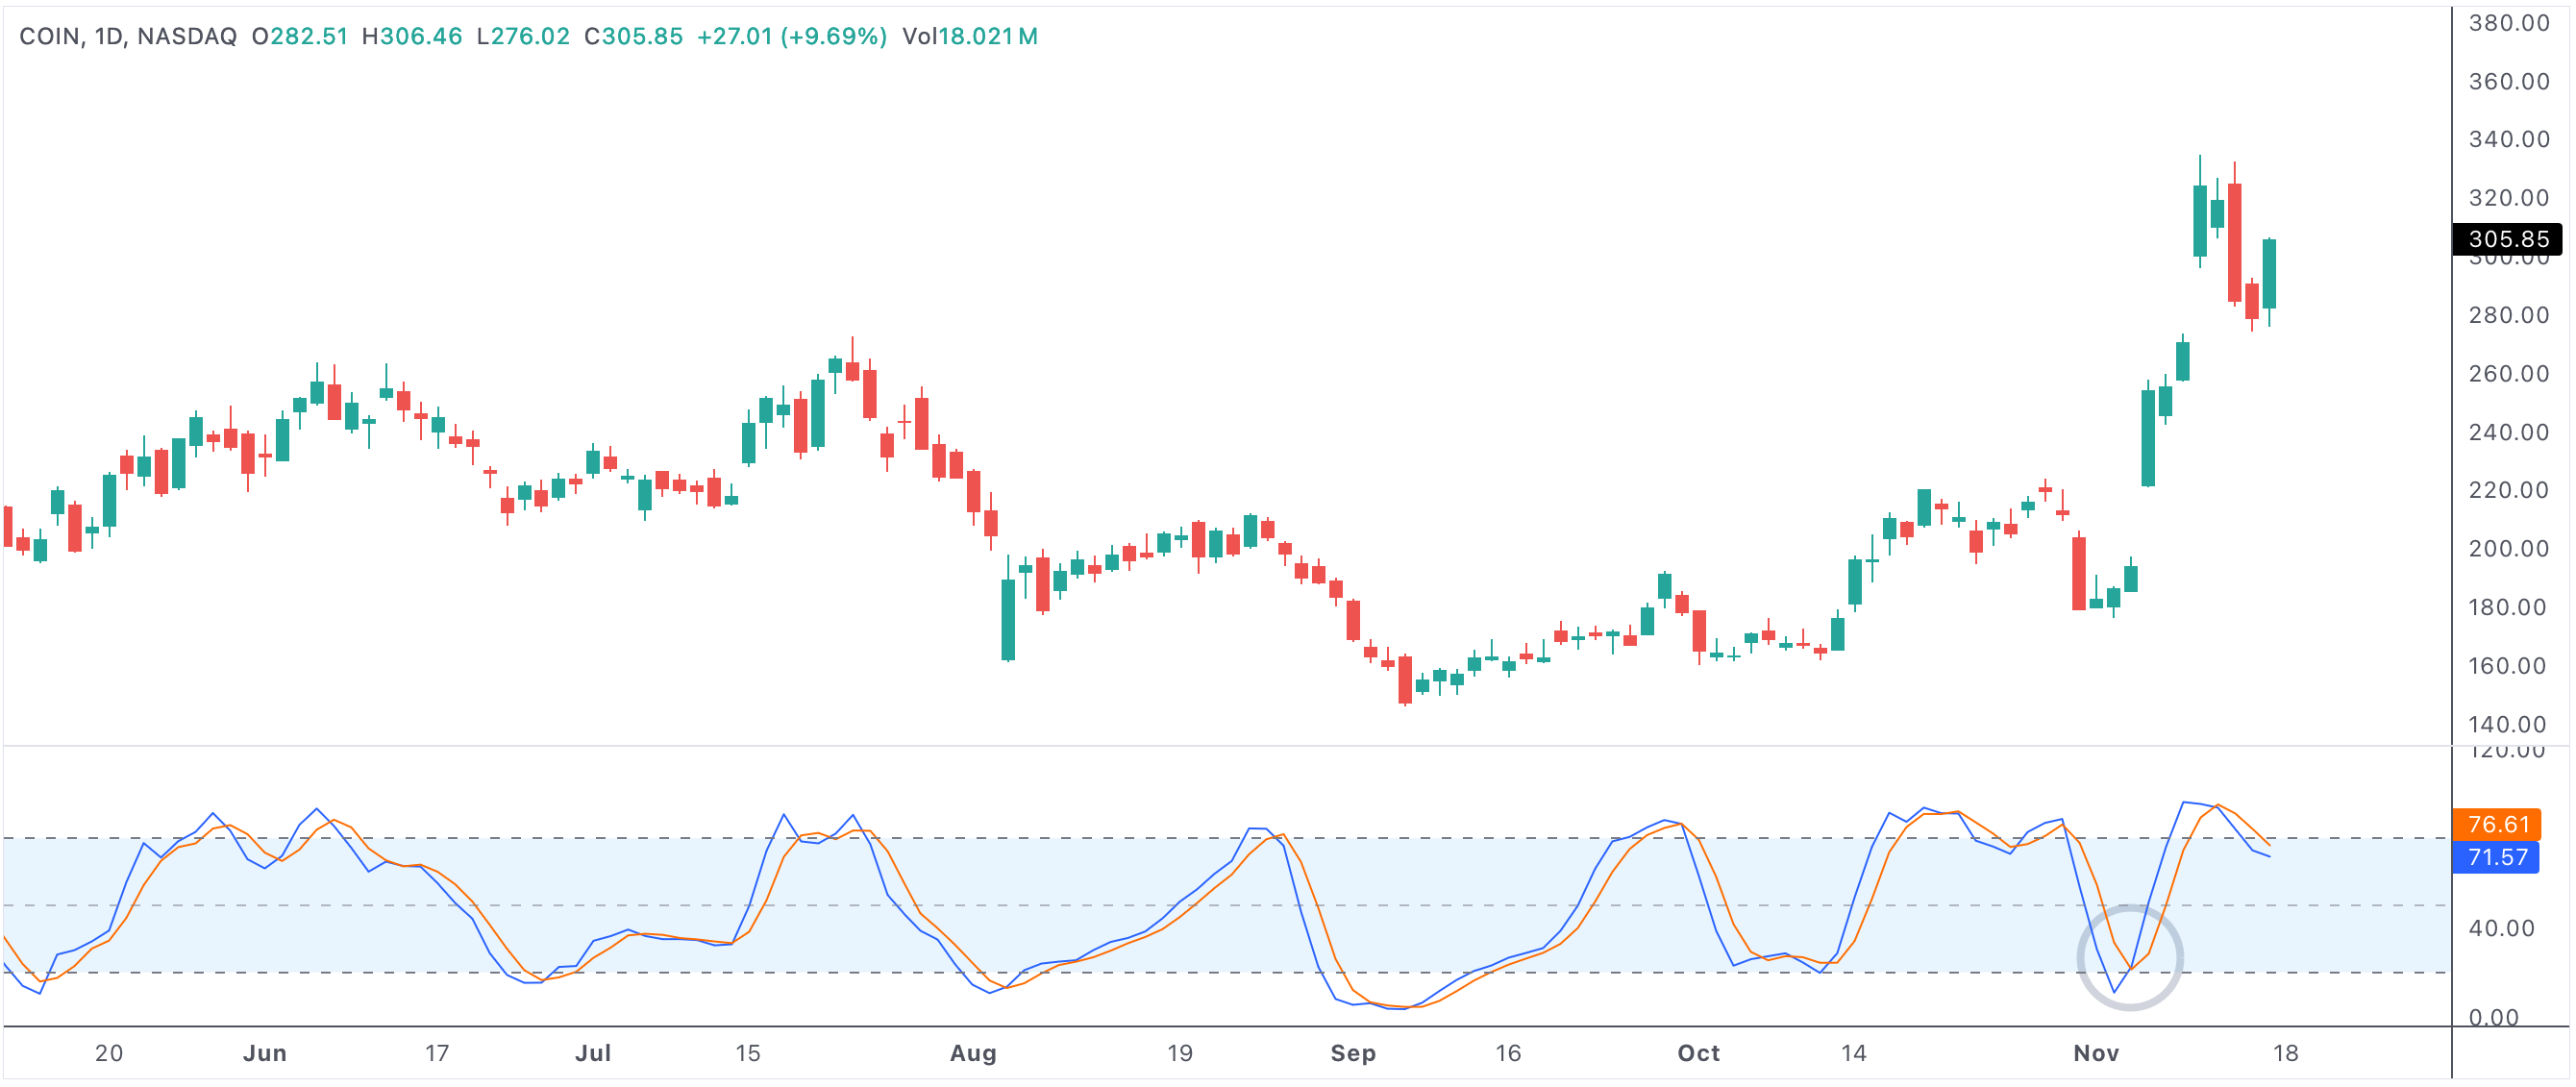
stochkcrossupd
Example of a stock experiencing a stochastic oscillator bullish cross, highlighting a possible shift from oversold to a buying phase.
Stochastic oscillator bullish cross
What is a Stochastic Oscillator Bullish Cross?
The stochastic oscillator is a widely used momentum indicator that compares a security’s closing price to its price range over a set period—often 14 days. The indicator is composed of two lines: %K (the fast-moving line) and %D (the slower-moving average of %K). A bullish cross happens when the %K line moves above the %D line, usually below the 20 level, signaling that the asset is recovering from oversold conditions. This cross is seen as a green light by many traders who are looking to catch the start of a new upward move.
Why Does the Bullish Cross Matter?
The bullish cross is meaningful because it represents a potential turning point where downward momentum slows, and buyers start to step in. The lower the cross occurs (especially below 20), the more powerful the signal can be, since it indicates that the market or stock may have been oversold. This is often the first indication that sentiment is shifting, providing an early entry opportunity for those who want to capitalize on a trend reversal before it becomes obvious to the wider market.
- Momentum shift: The cross indicates sellers are losing control, and bullish momentum may build.
- Early buying signal: Traders use this as an early alert for possible trend reversals.
- Works best in oversold conditions: The lower the oscillator, the greater the potential for a significant move.
How Do Traders Use the Bullish Cross?
Many traders enter long positions as soon as the %K line crosses above the %D line, especially when this happens in the oversold region. Some look for additional confirmation, such as a price breakout above a recent high, an uptick in trading volume, or bullish candlestick patterns. Others combine the stochastic bullish cross with broader technical signals, such as moving average crossovers or support/resistance zones, to strengthen their conviction and manage risk.
For swing traders and longer-term investors, the stochastic bullish cross can be used as an early warning to start monitoring a stock more closely, waiting for additional bullish confirmation before making larger commitments. Setting a stop-loss below the recent swing low is a common risk management strategy, since false signals are always possible in volatile or strongly trending markets.
Limitations and Best Practices
While the stochastic oscillator bullish cross is a valuable signal, it is not infallible. In strongly trending markets—especially powerful downtrends—oscillators can remain oversold for extended periods, and false signals can occur. This is why experienced traders combine the stochastic signal with other forms of technical or fundamental analysis and pay attention to broader market context. Proper risk controls, like stop-losses and position sizing, are essential for managing potential whipsaws.
Summary: Spotting Momentum Shifts Early
The stochastic oscillator bullish cross stands out as an early indicator for potential trend reversals, offering technical traders and investors a chance to spot momentum shifts as stocks exit oversold territory. When confirmed by other signals and supported by a favorable market environment, this cross can offer attractive opportunities for early entry and improved risk-reward in both short- and long-term trading strategies.