Stocks closing lower on above average volume - bearish signals and reversals
When stocks close lower on above average volume, it often draws the attention of traders and investors alike. This scenario usually reflects a strong conviction among sellers, highlighting a significant shift in sentiment that can lead to continued downside pressure. Volume, as a technical indicator, measures the number of shares traded in a given period and, when above its moving average, reveals heightened participation and urgency in the market.
downonvolume
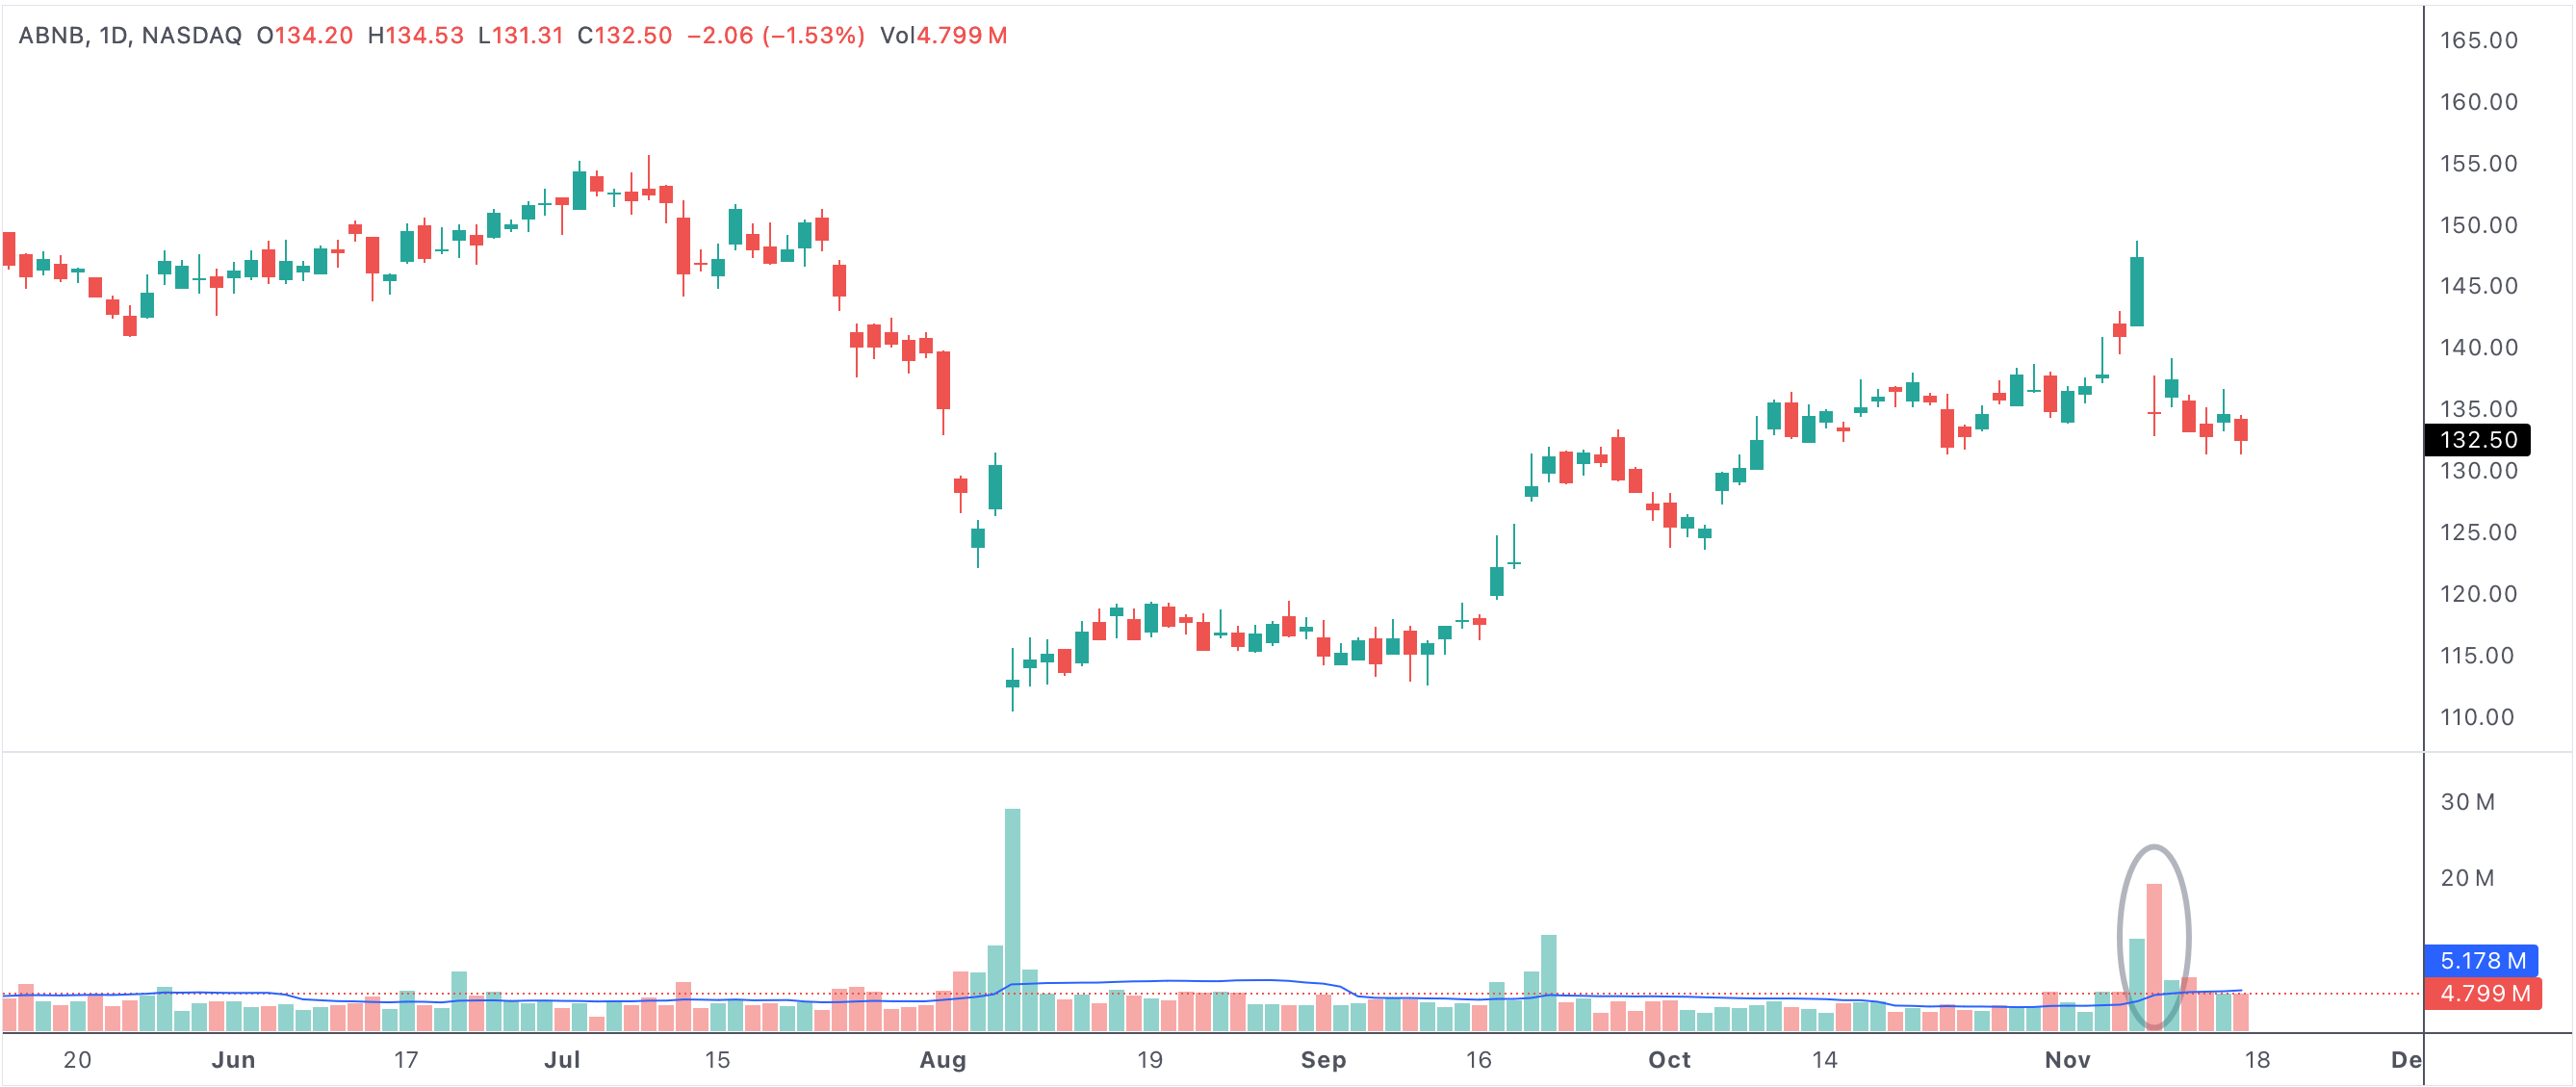
An example of a stock that closed lower on above average volume
Stocks closed lower on above average volume
Understanding the Bearish Implications of High-Volume Declines
In technical analysis, a stock that declines on heavy volume is often seen as confirming a bearish trend. Above average volume indicates that more market participants are eager to sell than buy, which can be caused by disappointing earnings, negative news, or shifts in broader economic conditions. This rush to the exits amplifies price declines and can quickly erode investor confidence.
Such down moves frequently coincide with breakdowns of important support levels, further reinforcing negative sentiment. When these high-volume sell-offs appear alongside other bearish signals—such as downward moving averages or weak sector performance—the probability of a continued downtrend increases. Investors may view repeated high-volume declines as a warning sign to reduce exposure or employ tighter risk management.
What High Volume Really Tells Us
High trading volume during declines reflects the determination of sellers to exit their positions. Sometimes, these moves are driven by institutional investors reallocating portfolios or responding to macroeconomic shocks. Unlike routine pullbacks on light volume, high-volume declines send a clear message that conviction is strong on the downside.
For those studying the tape, watching volume patterns can help distinguish between temporary volatility and the start of a more meaningful trend. A one-off decline on high volume might be news-driven and short-lived, while repeated episodes may foreshadow deeper trouble for the stock or sector.
Support Levels and the Potential for Reversal
While high-volume declines often confirm bearish sentiment, they can also set the stage for a bullish reversal—especially if prices approach significant technical support. Support levels, such as previous lows, major moving averages, or trendlines, are watched closely by both traders and algorithms. If a stock finds buyers willing to absorb the increased supply at these points, it may stabilize and even bounce.
Volume spikes at support can also represent capitulation, where most sellers have already exited. Savvy investors often look for reversal candlestick patterns or other signals in these areas, combining price action with volume analysis to spot early signs of recovery. However, if support fails and selling continues, the stock may enter a new phase of the downtrend.
- High-volume declines indicate strong selling pressure and reinforce bearish sentiment.
- These moves may occur after negative news, earnings misses, or economic shocks.
- Breakdowns below key support on heavy volume often lead to further downside.
- If a stock finds support despite elevated volume, a reversal or bounce may occur.
- Persistent high-volume declines without support are strong bearish signals.
Using Volume Analysis for Better Decision Making
Integrating volume analysis into your trading or investing process helps add conviction to your decisions. When stocks close lower on above average volume, consider reducing risk or waiting for clearer signs of a reversal before re-entering. If you notice volume drying up as prices stabilize, it may signal that sellers are exhausted, opening the door for a possible rebound.
Ultimately, monitoring how price reacts to key levels on strong volume can help you distinguish between temporary volatility and more significant trend changes. Use volume in conjunction with other indicators, such as RSI, MACD, or moving averages, for the most robust signals.
In summary, stocks closing lower on above average volume are worth watching closely. While often a sign of bearish sentiment and selling conviction, they can also provide opportunities if a reversal forms at well-defined support. Understanding volume’s message is key to better timing and risk management in today’s dynamic markets.