Stocks losing momentum after strong gains - RSI cross down 50 signals shift
When a stock or index has experienced a prolonged period of strength, the loss of momentum can become apparent when the Relative Strength Index (RSI) crosses below the critical 50 level. This technical signal, watched closely by traders and investors, suggests that the balance of power is shifting from buyers to sellers. After a notable uptrend, the first RSI cross down through 50 marks a clear change in momentum that can carry significant implications for future price action.
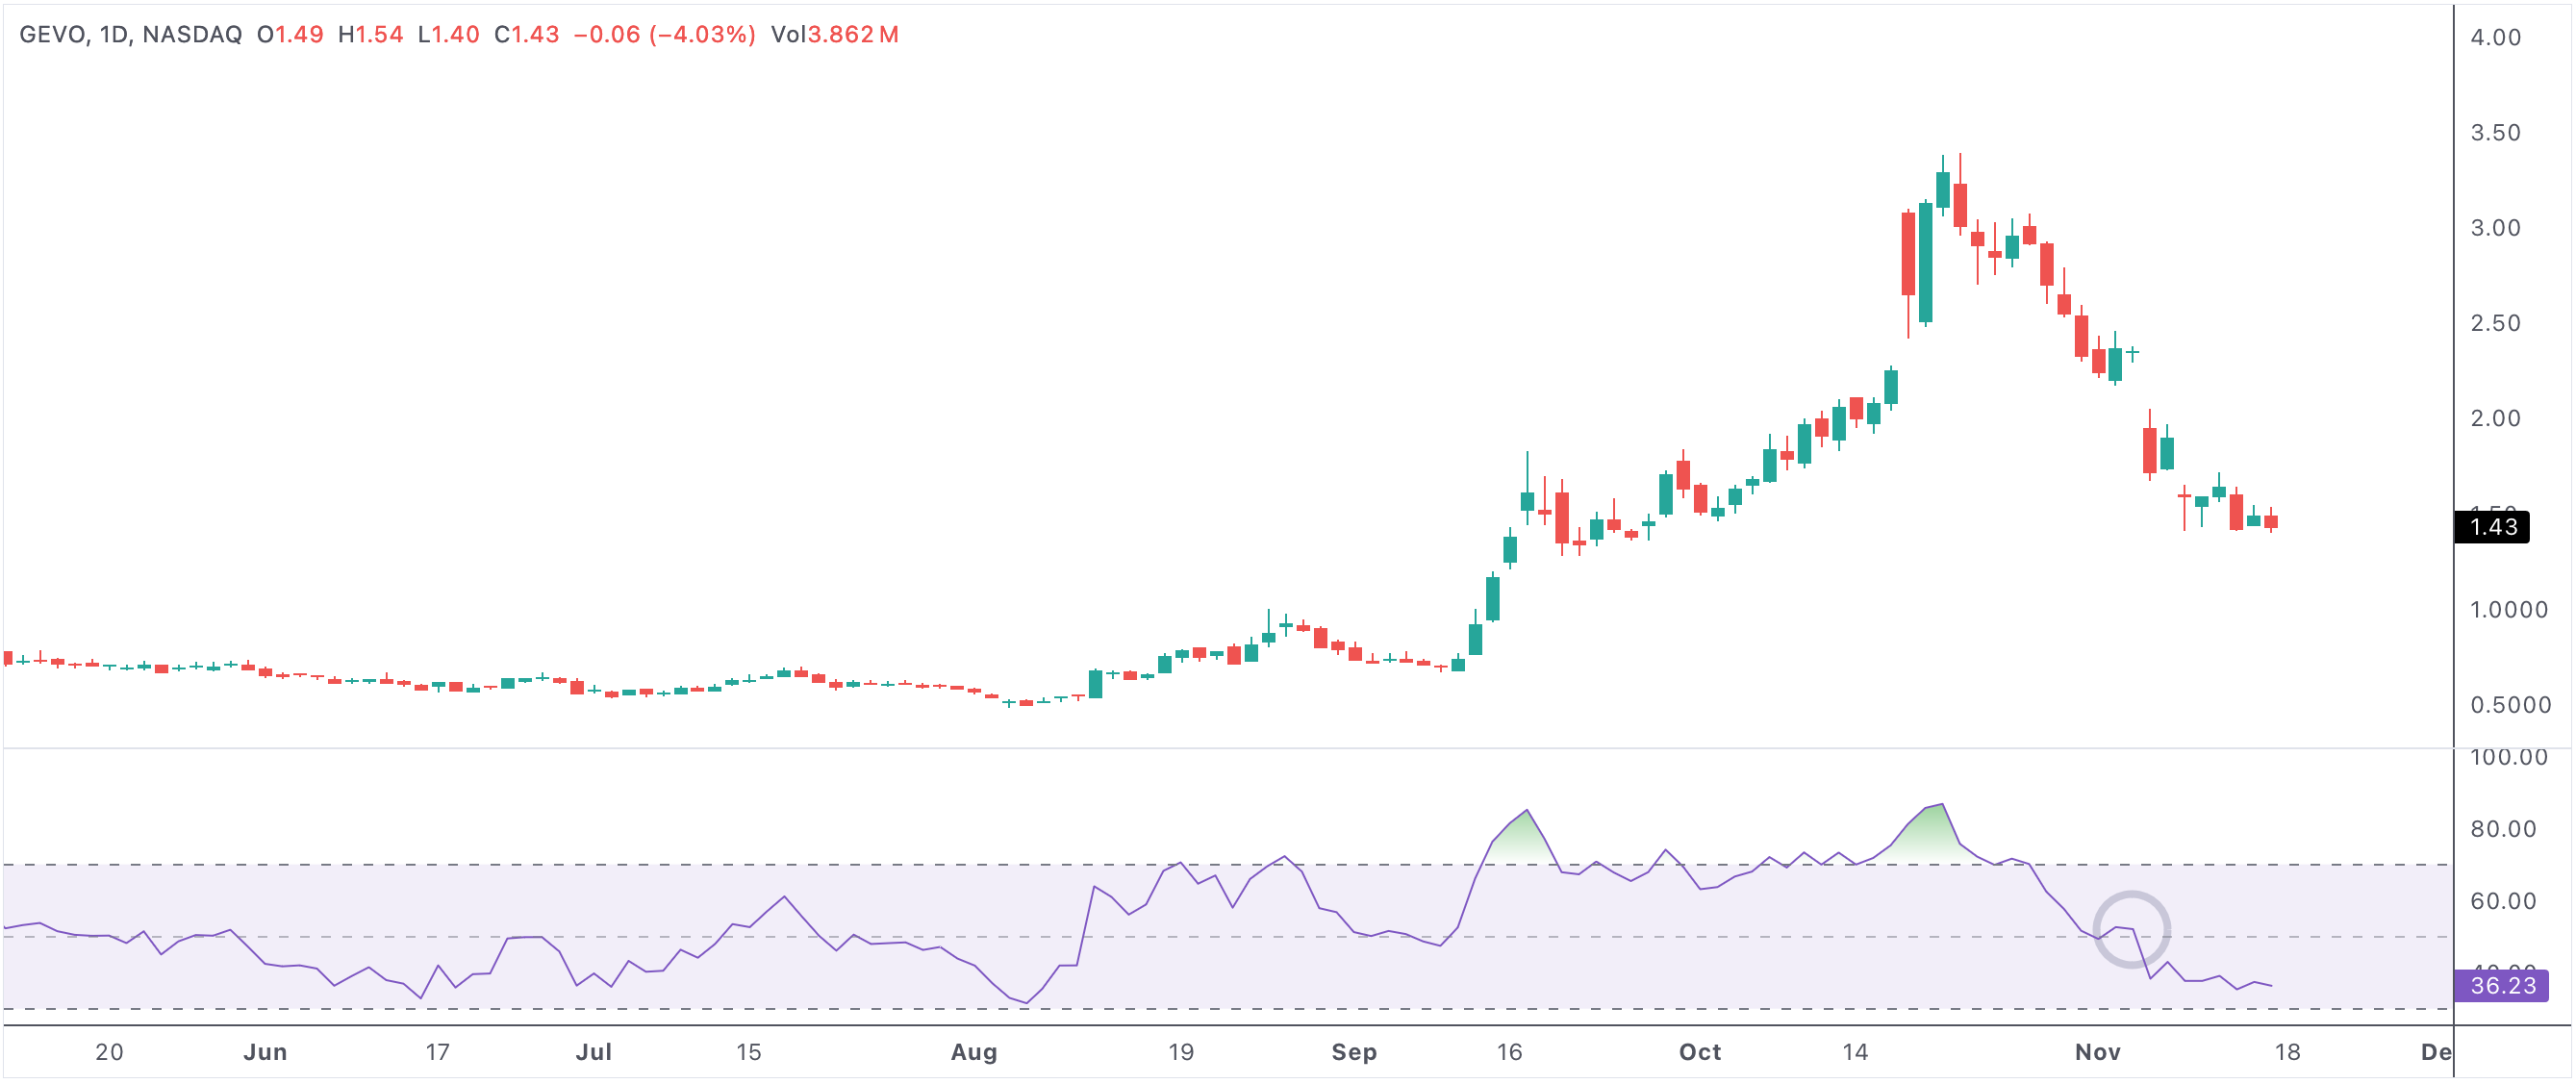
rsicrossdown50
An example of a stock with the RSI crossing down 50 after a strong rally
Stocks losing momentum after a period of strength and RSI crossing down 50
What Does RSI Crossing Below 50 Mean?
The Relative Strength Index is a momentum oscillator that fluctuates between 0 and 100. Traditionally, readings above 70 indicate overbought conditions, while readings below 30 suggest oversold territory. The midpoint at 50 is a key dividing line between bullish and bearish momentum. When the RSI crosses below 50, it often means that recent gains are losing steam and that the buying pressure is giving way to selling interest. This shift is commonly interpreted as a signal that the recent uptrend is weakening, increasing the risk of further downside or sideways consolidation.
Interpreting Momentum Loss After Strength
After a strong run-up in price, it is natural for markets to pause or pull back. The RSI crossing down through 50 after such a rally does not always mark the beginning of a major downtrend. Sometimes, it signals a healthy period of consolidation where price trades sideways or gently lower as investors digest gains. However, if the loss of momentum is accompanied by negative catalysts or broader market weakness, it may serve as the first warning of a deeper correction.
- RSI dropping below 50 highlights fading bullish momentum after an extended uptrend.
- This shift can trigger caution among investors and traders, prompting tighter risk management or profit-taking.
- Consolidation or sideways trading often follows as the market decides whether to resume the uptrend or reverse.
- If the price stabilizes and RSI begins to recover, it could attract new buyers and set up a bullish reversal.
- On the other hand, continued weakness may confirm a new bearish phase, especially if other indicators align.
Trading Strategies and Confirmation
Traders rarely rely on RSI cross downs in isolation. The best results come from combining the RSI signal with other technical factors, such as support and resistance zones, price patterns, volume analysis, or moving averages. For example, a stock whose RSI drops below 50 but finds support at a prior breakout level may be in the process of consolidating before another move higher. Conversely, a cross below 50 paired with a breakdown in price structure and rising volume can be an early sign of a more pronounced bearish reversal.
Institutional investors may view such consolidations as opportunities to accumulate positions at better prices, especially if fundamentals remain strong. For aggressive traders, a failed bounce after RSI crosses down 50 may present a short-term selling opportunity. The key is to monitor subsequent price action and look for confirming evidence from multiple sources.
Context Matters: Not All Momentum Losses Are Bearish
While the loss of momentum is a clear signal of changing dynamics, it is not always a precursor to major declines. In bull markets, such pullbacks and consolidations can be brief and shallow, serving as springboards for the next leg up. Patient investors may use the pause in momentum to identify stocks with strong fundamentals that are temporarily out of favor.
For those monitoring RSI cross down 50 scans, the critical factor is context: understanding where the stock is in its trend, how it responds to support, and whether there is renewed buying as conditions stabilize.
Summary: Using RSI Cross Down 50 in Momentum Analysis
A loss of momentum as measured by the RSI crossing below 50 after a period of strength is a valuable signal for managing risk, adjusting strategy, or scouting new opportunities. While it often triggers caution, it can also highlight zones of accumulation and set the stage for bullish reversals if the underlying trend remains healthy. By combining RSI readings with price action, volume, and broader market signals, traders and investors can gain a deeper edge in navigating periods of changing momentum.